Trig Charts
Trig charts, or trigonometric charts, are used to provide a quick reference for the values of trigonometric ratios. These ratios, such as sine, cosine, and tangent, are used in trigonometry to study the relationships between the angles and sides of triangles. The trig chart typically lists the values of these ratios for specific angles, making it easier for students or users to solve trigonometric problems or calculate the values of unknown angles or sides in a triangle.
Documents:
1
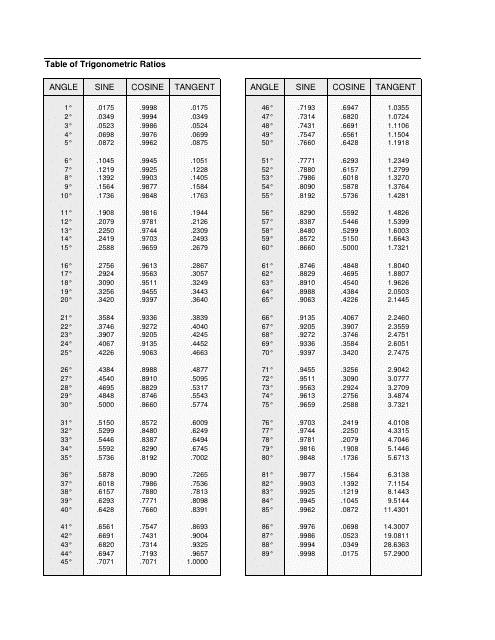
This document provides a handy reference guide for the different trigonometric ratios used in trigonometry calculations. It outlines the relationships between the angles of a triangle and their corresponding ratios such as sine, cosine, and tangent.
