Solvent Charts
The Solvent Chart is a reference tool that provides information on different organic solvents. It includes properties such as boiling point, melting point, density, polarity, and other characteristics. This chart is used to help scientists, researchers, and professionals in various industries select the most appropriate solvent for their specific needs, such as chemical reactions, cleaning, or extraction processes.
Documents:
2
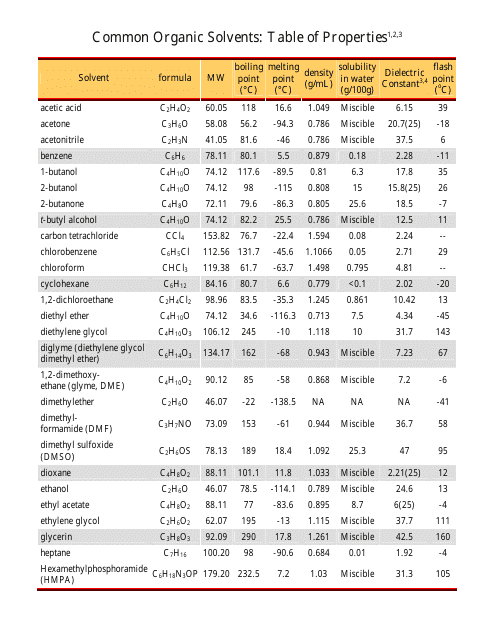
This document provides a table of properties for common organic solvents, including their color.
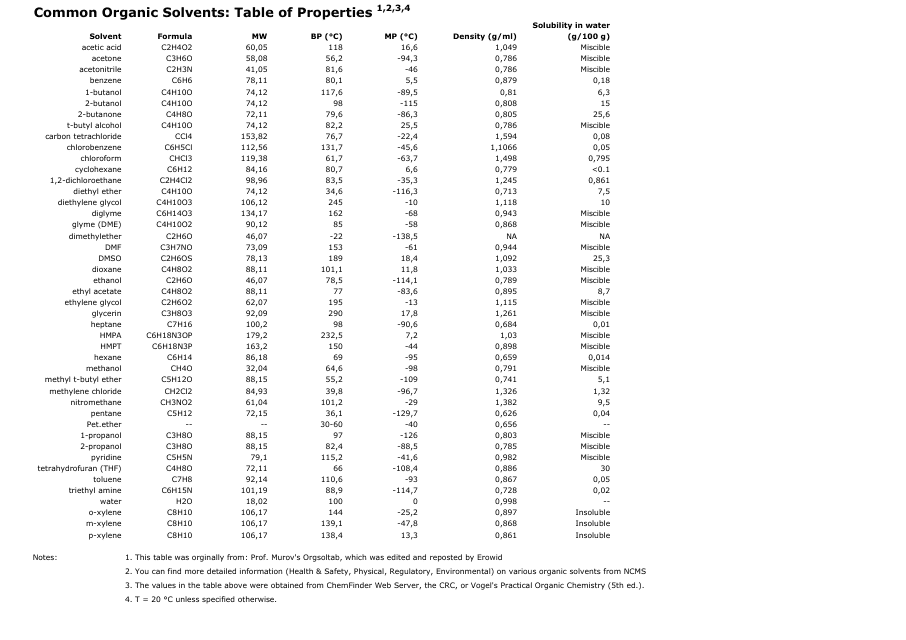
This document provides a table of properties for commonly used organic solvents. It helps in understanding the characteristics and uses of different solvents.
