Data Presentation Templates
Data Presentation
Welcome to our comprehensive collection of resources and tools dedicated to data presentation. Whether you're a data analyst, researcher, or simply interested in visualizing and communicating data effectively, we have everything you need to transform complex numbers into compelling stories.
Our data presentation resources cover a wide spectrum of topics, from traditional spreadsheets and graphs to modern interactive dashboards and infographics. We understand that everyone has a different goal and preferred method to present data, so we provide a variety of techniques and strategies to suit your needs.
Explore our library of documents and discover helpful resources such as our Counting Study Reporting Form and 10 X 10 Spreadsheet Template. These tools will streamline your data analysis process and make it easier for you to organize and present your findings.
Looking to take your data presentations to the next level? Our collection also includes resources like "A Guide to Creating Dashboards People Love to Use" by Juice Analytics. This guide offers expert tips and best practices for designing captivating dashboards that convey your data in an engaging and accessible way.
For those familiar with coding and statistical analysis, we offer handy references such as the Rmarkdown Cheat Sheet and the Knitr Reference Sheet. These resources will assist you in leveraging powerful tools and libraries to generate dynamic and visually appealing data presentations.
No matter your level of expertise or preferred method of data presentation, our collection has something for everyone. We are dedicated to helping you tell your data's story effectively, making complex information accessible and understandable to your audience.
Browse through our comprehensive collection of data presentation resources and begin transforming your data into impactful visuals today.
Documents:
6
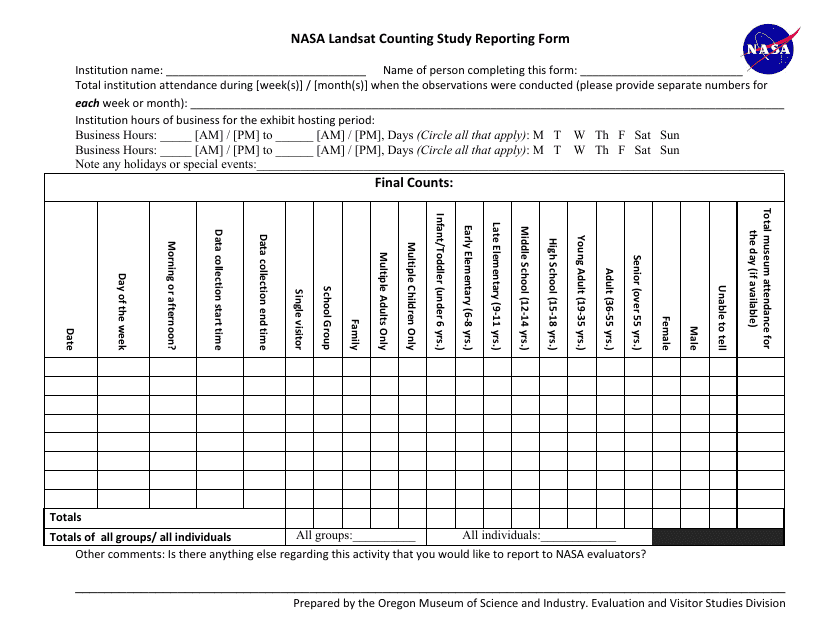
This Form is used for reporting the results of a counting study. It is used to document and summarize the data collected during a counting study, which is a research method used to quantify or assess the number of items or occurrences of interest.

This document provides a template for a 10 by 10 spreadsheet, allowing you to organize and calculate data in a grid format.

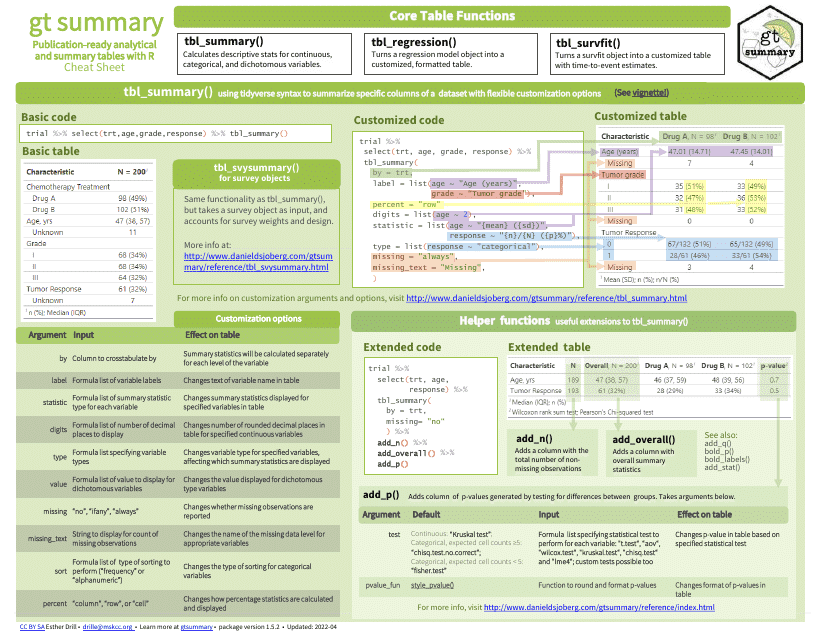
This document is a cheat sheet for using the gtsummary package, which provides summary tables and statistics for data analysis in R. It includes tips and examples for creating and customizing tables using the gtsummary functions.
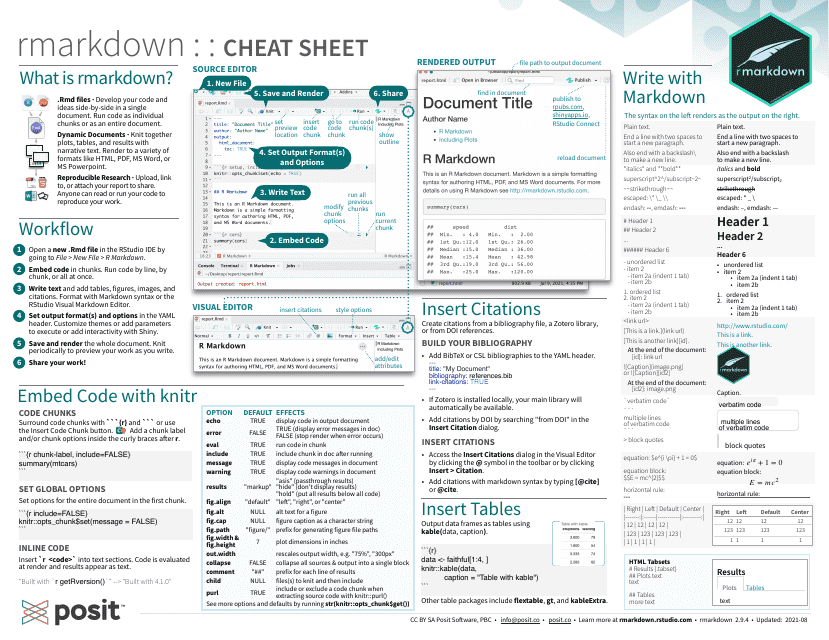
This document provides a cheat sheet for Rmarkdown, a popular tool for creating dynamic documents in R. It includes tips and examples for formatting text, adding images and tables, and generating various types of output.
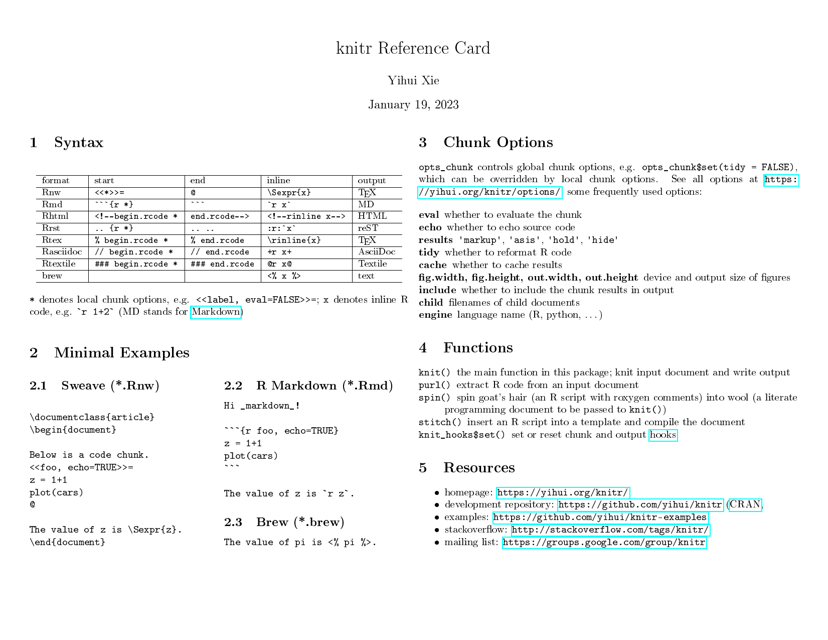
This document provides a reference sheet for using the knitr package in R Markdown. It includes information on how to generate reports with knitr, customize output, and format code chunks.
