Data Visualization Templates
Data Visualization: Unlock the Power of Data with Stunning Visuals
In today's data-driven world, effectively communicating information is essential. Enter data visualization - the art of transforming complex data into visually appealing charts, graphs, and interactive visuals. With data visualization, you can present complex information in a way that is easy to understand, engaging, and impactful.
Our collection of data visualization resources offers a comprehensive guide for professionals, researchers, and data enthusiasts looking to harness the potential of their data. Whether you're a beginner or an expert in the field, our resources provide valuable insights, tips, and tricks to help you become a master storyteller through visual representations.
From cheat sheets on popular data visualization tools like R and Python to in-depth tutorials on advanced techniques, our library covers it all. Discover the power of Consular Affairs by the Numbers, explore the functionalities of R Package Xpose, get started with Python for Data Science, or dive into the world of Gtsummary. These resources are designed to empower you with the knowledge and skills needed to create stunning visualizations that make an impact.
By leveraging the principles of data visualization, you can transform raw data into actionable insights. Whether you're analyzing sales trends, conducting market research, or presenting scientific findings, our data visualization resources will help you effectively communicate your message and uncover valuable patterns and trends.
Embrace the alternate names of data visualization or visualizing data and embark on a journey to unleash the true potential of your data. Start exploring our collection of resources today to take your data visualizations to the next level.
Documents:
57
This template is used to create bar graphs for various purposes. It provides a basic layout for organizing data and visualizing trends using bars of different lengths. Customizable and easy to use.
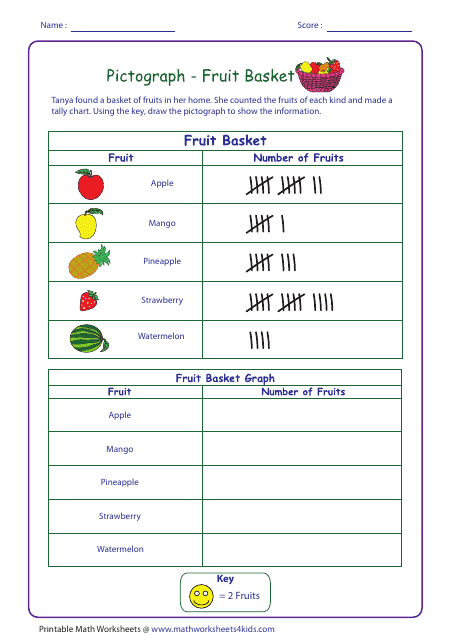
This document is a fruit basket pictograph worksheet with an answer key. It is used to teach and practice interpreting pictographs representing different types of fruits.
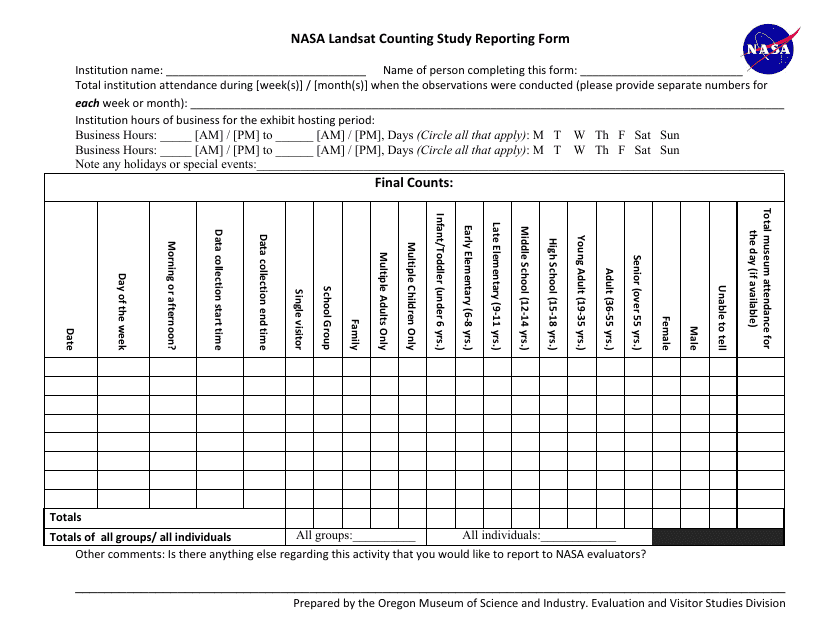
This Form is used for reporting the results of a counting study. It is used to document and summarize the data collected during a counting study, which is a research method used to quantify or assess the number of items or occurrences of interest.
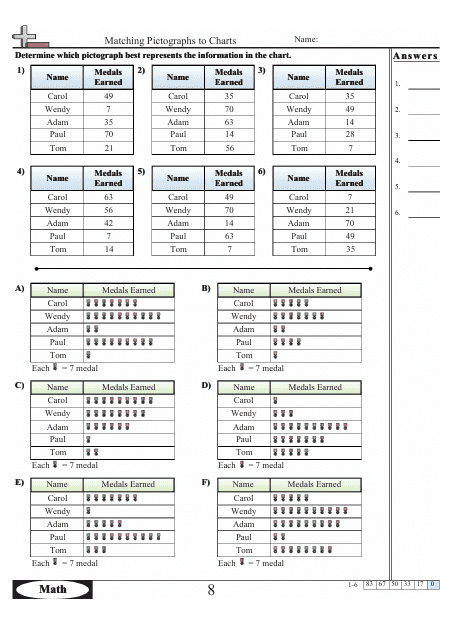
This document is a worksheet that helps you match pictographs to charts. It also includes an answer key to check your answers. Great for practicing data interpretation skills!
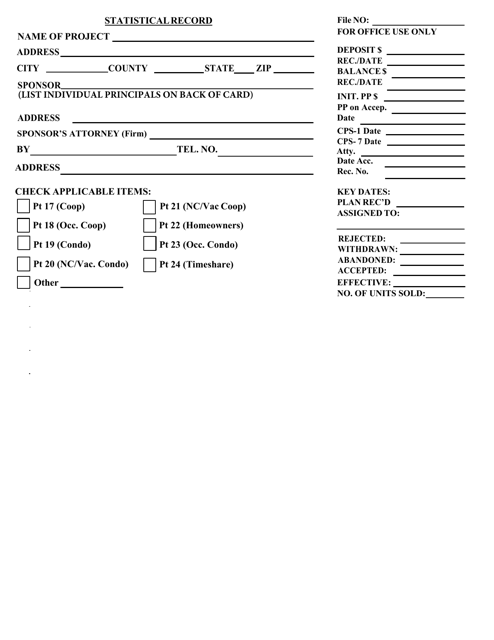
This document is a statistical record that contains data and information pertaining to the state of New York. It provides various statistics and facts about different aspects of New York, such as population, economy, education, and more.

This document provides a template for a 10 by 10 spreadsheet, allowing you to organize and calculate data in a grid format.
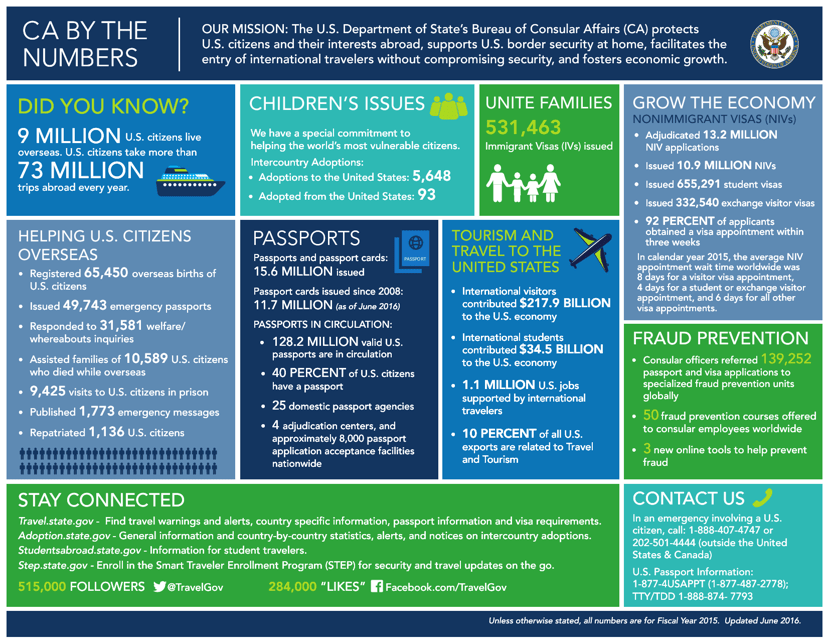
This document provides statistics and figures related to consular affairs.
This type of document introduces Treeversity, a tool that allows users to compare hierarchical datasets through interactive visualizations. Treeversity provides a unique and user-friendly way to analyze and explore data in a hierarchical structure.

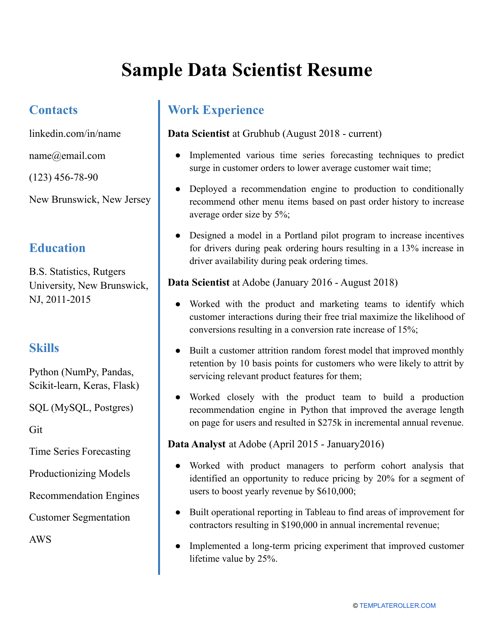
This is a sample resume used by job applicants to introduce themselves to a future employer and showcase their academic and professional accomplishments in data science.
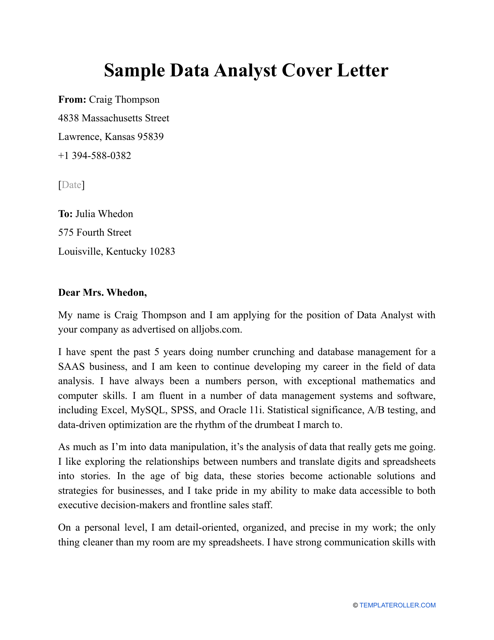
Job applicants can use this sample as a reference to provide an employer with an overview of their accomplishments to date and explain their interest in a data analyst job vacancy.
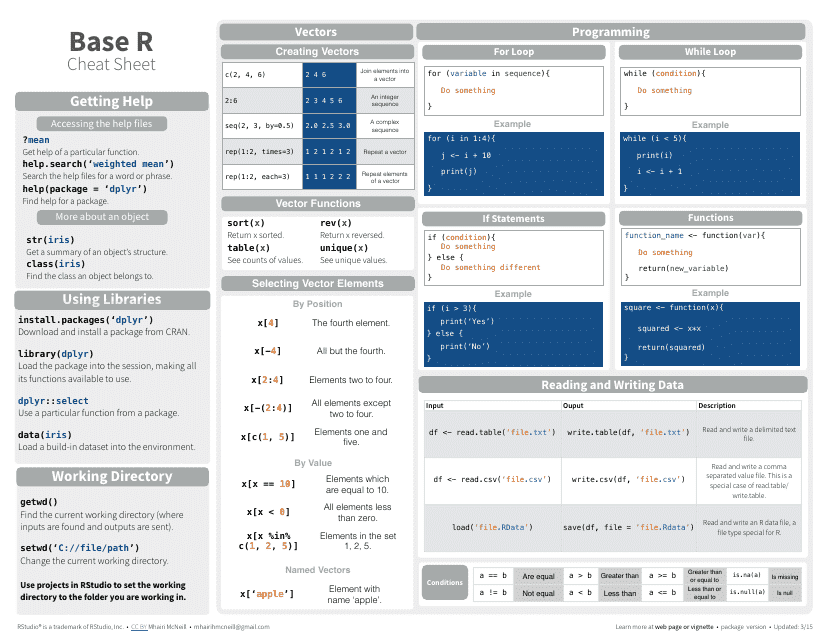
This document is a cheat sheet for the base R programming language. It provides a quick reference to the most commonly used functions and syntax in R.
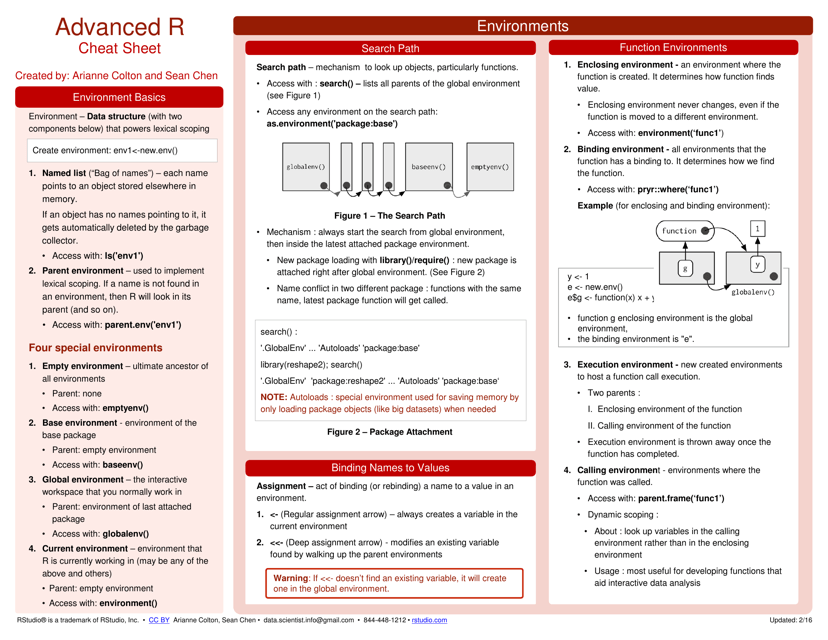
This document provides a handy reference guide for experienced R users with advanced features and functions. It includes shortcuts, syntax examples, and tips to improve efficiency in R programming.
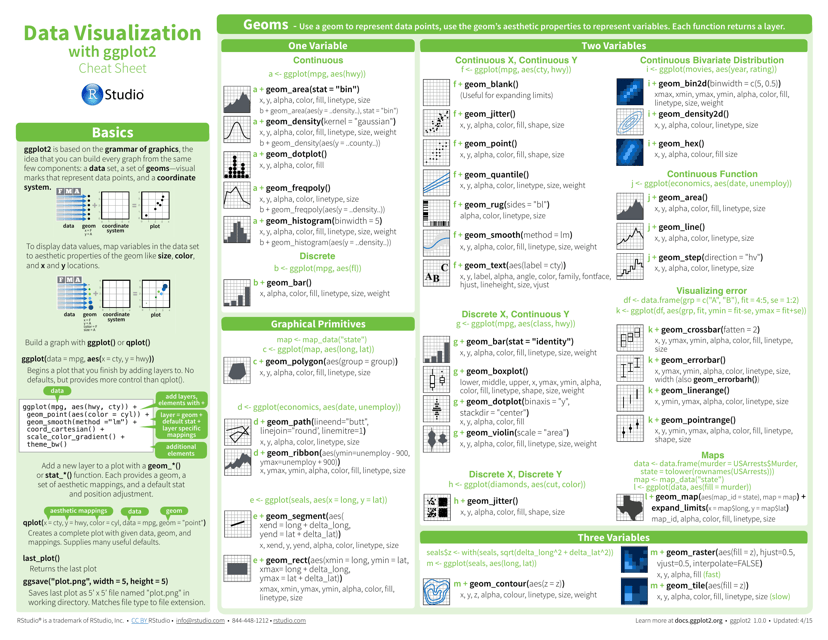
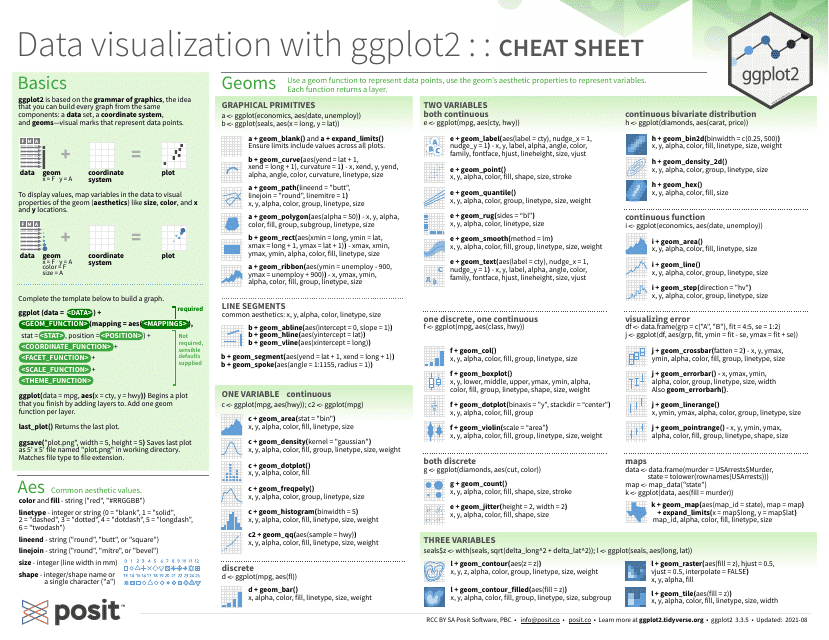
This document is a cheat sheet for using the ggplot2 package in RStudio for data visualization purposes. It provides a quick reference guide for creating various types of plots and customizing visuals.
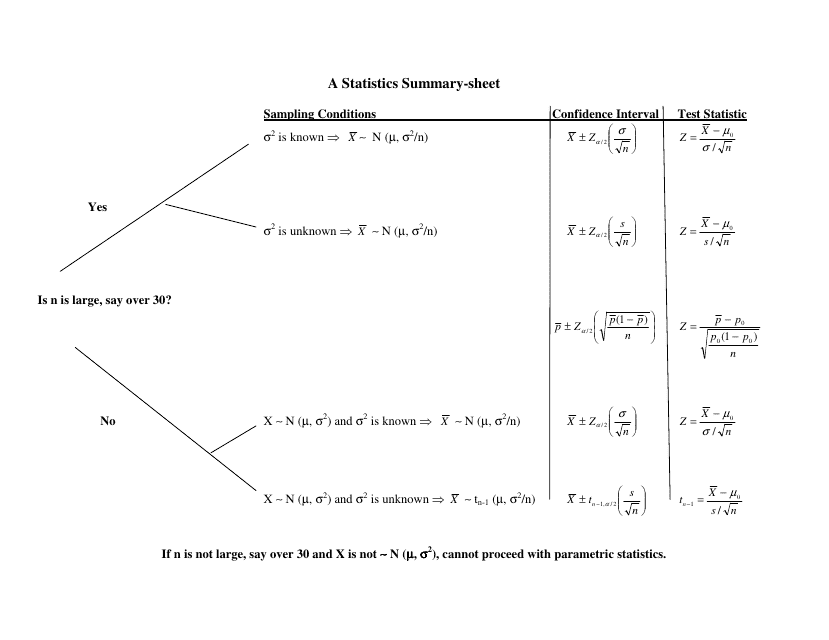
This document provides a condensed overview of statistical theory and formulas. It serves as a helpful reference for understanding key concepts and calculations in statistics.
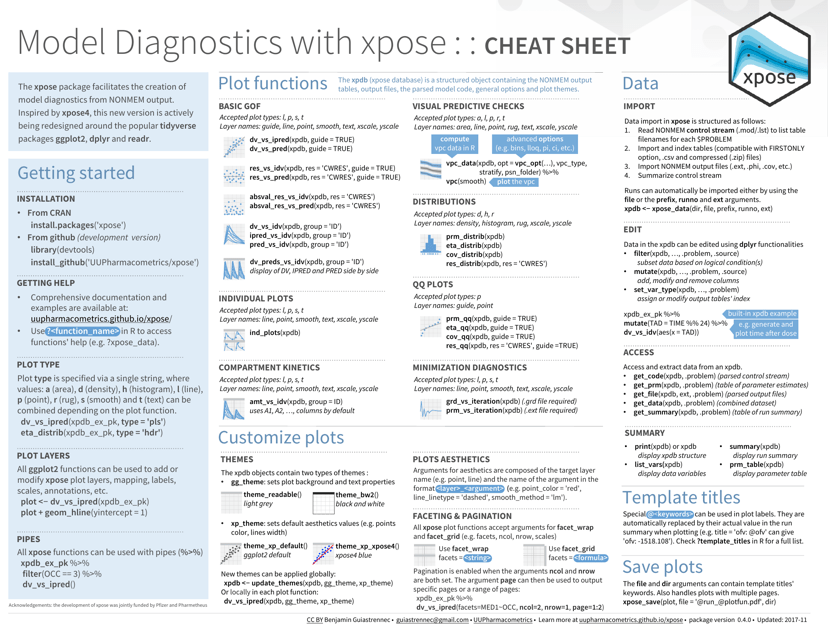
This cheat sheet provides a quick reference guide for using the R package Xpose. It includes essential information and syntax examples to help users analyze pharmacometric data.
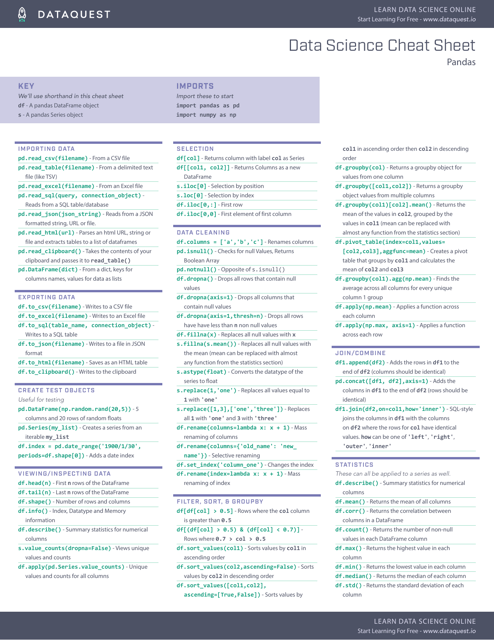
This document provides a cheat sheet for using the Pandas library in data science. It contains helpful tips and examples for manipulating and analyzing data using Pandas.
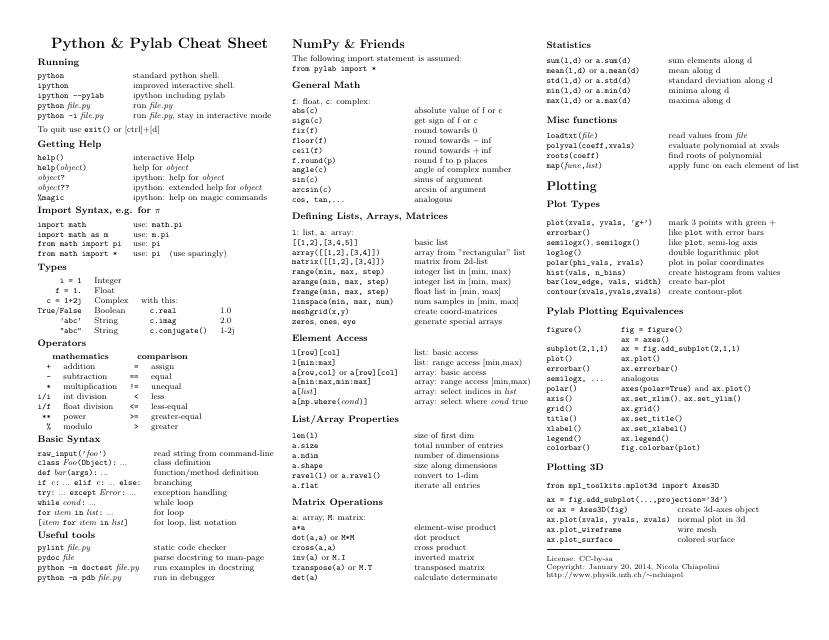
This cheat sheet provides a quick reference guide for using Python and Pylab. It includes common Python syntax and functions, as well as specific commands for data visualization using Pylab.
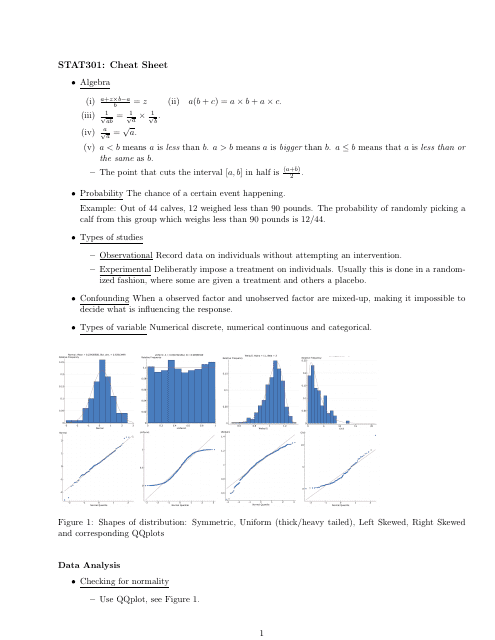
This document is a cheat sheet for the subject of Stat301. It provides a concise summary of key concepts and formulas for easy reference.
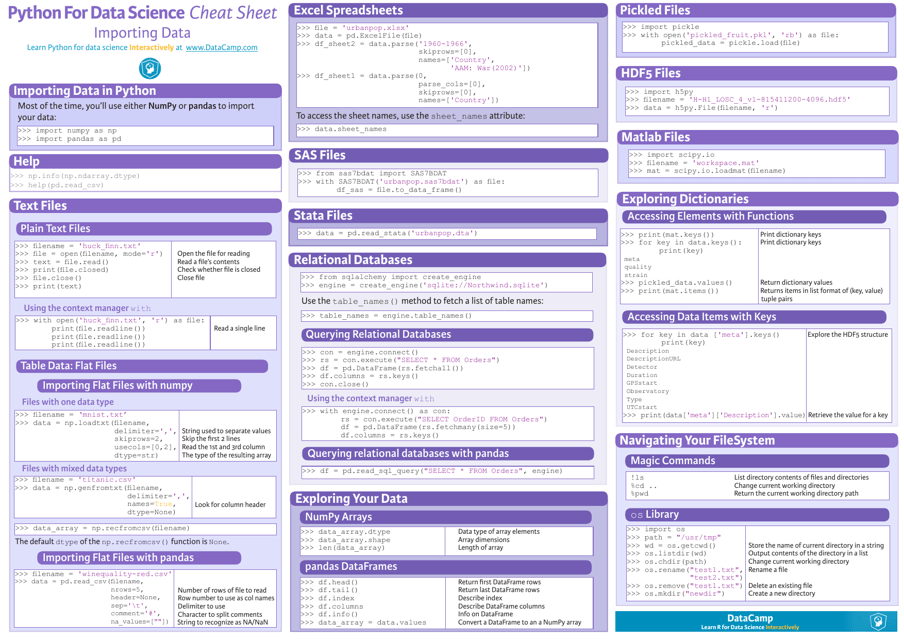
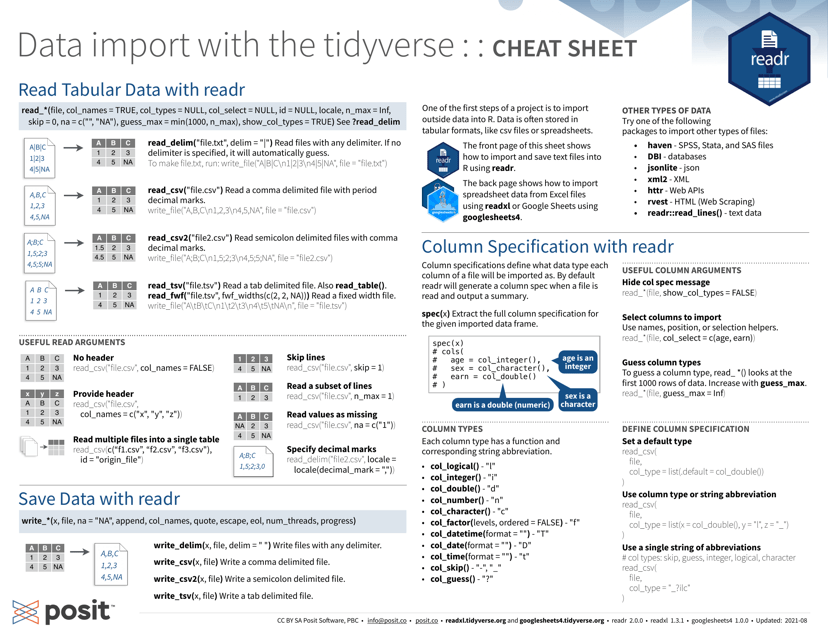
This cheat sheet provides a quick reference guide for importing data in Python for data science tasks. It covers various methods and libraries used to import data from different sources in Python.
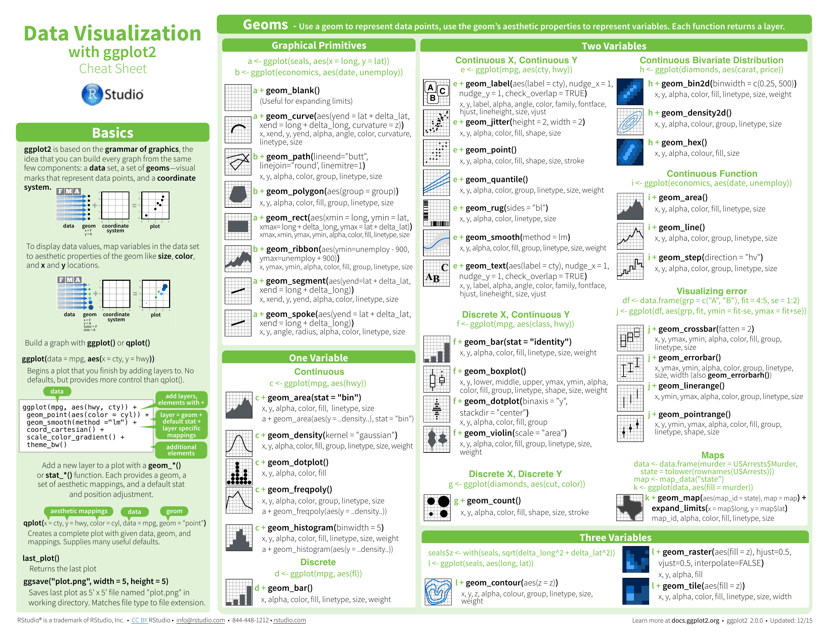
This document provides a handy reference guide for using the ggplot2 package in R for creating high-quality and customizable data visualizations. It includes examples and syntax for various plot types and options.
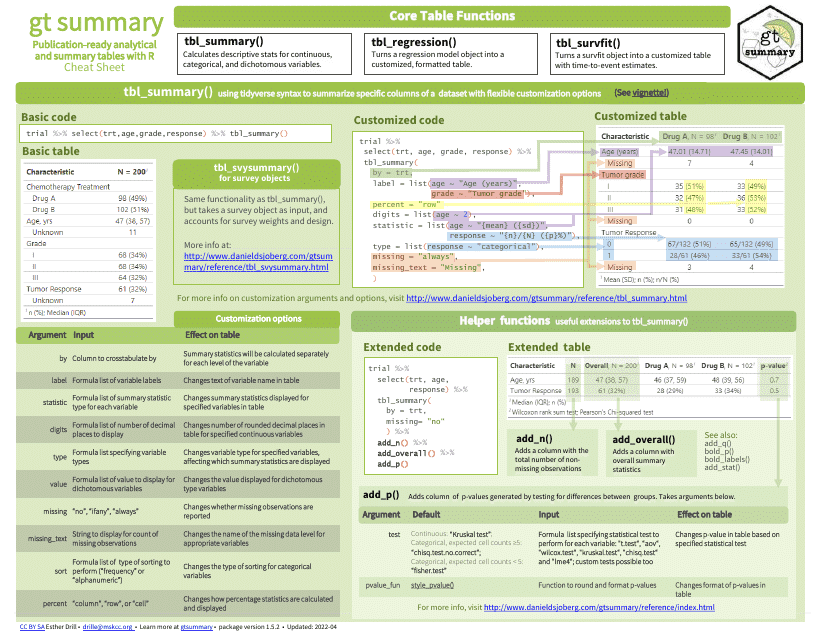
This document is a cheat sheet for using the gtsummary package, which provides summary tables and statistics for data analysis in R. It includes tips and examples for creating and customizing tables using the gtsummary functions.
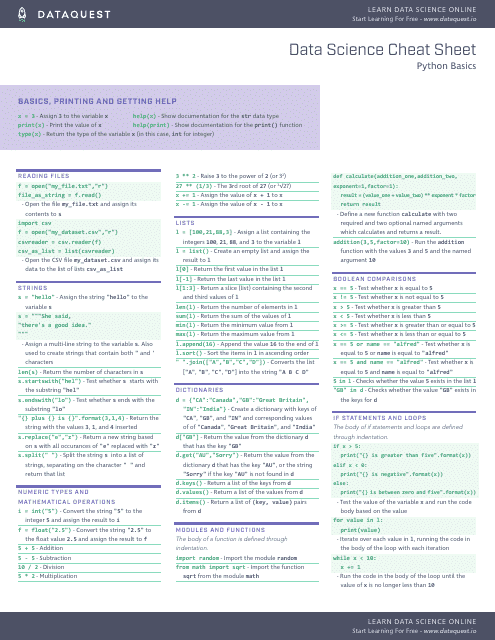
This cheat sheet provides a quick reference guide for Python basics in the context of data science. It covers essential concepts and syntax in Python for data manipulation and analysis.
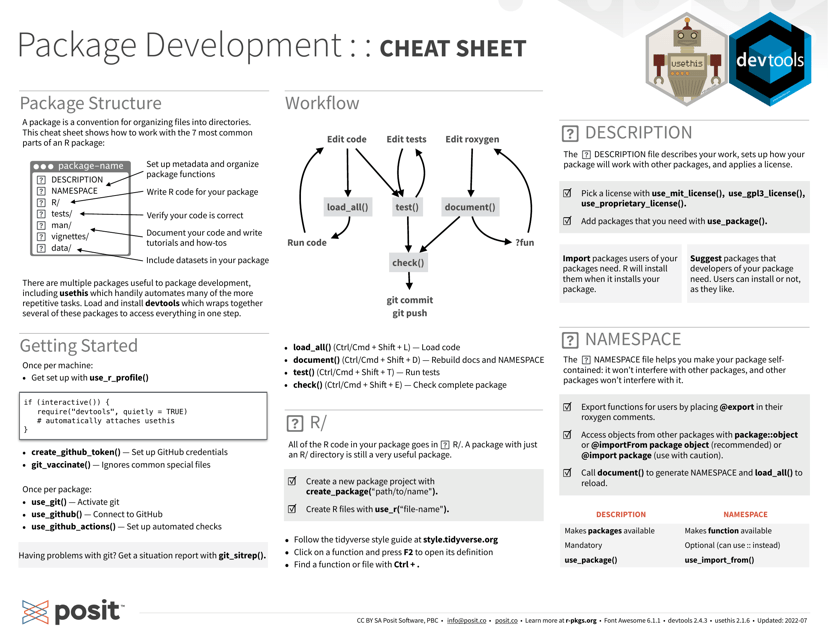
This document provides a concise and useful reference guide for developing R packages. It includes information and tips on package structure, documentation, version control, and other essential aspects of package development.
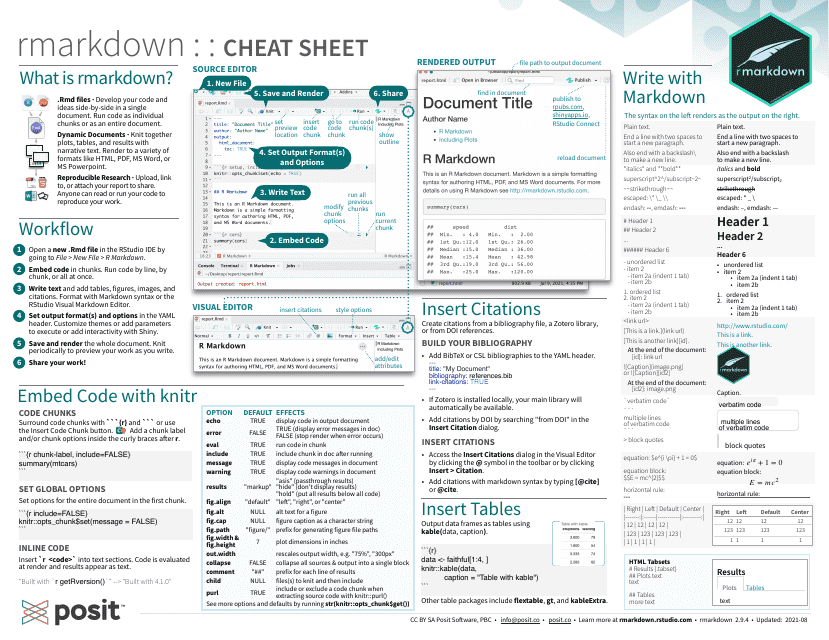
This document provides a cheat sheet for Rmarkdown, a popular tool for creating dynamic documents in R. It includes tips and examples for formatting text, adding images and tables, and generating various types of output.
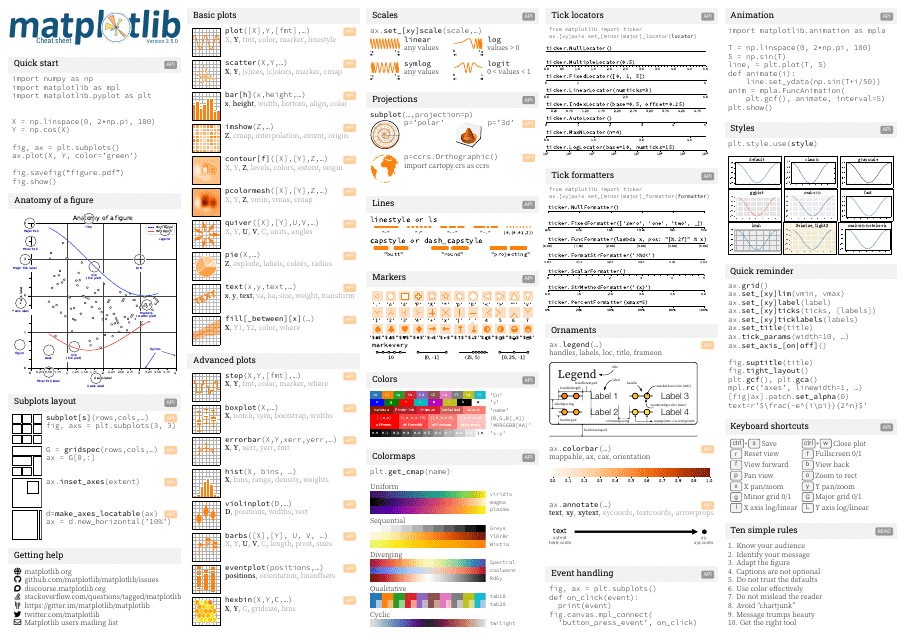
This document is a cheat sheet for Matplotlib, a popular data visualization library in Python. It provides a quick reference guide for different plotting functions and techniques.
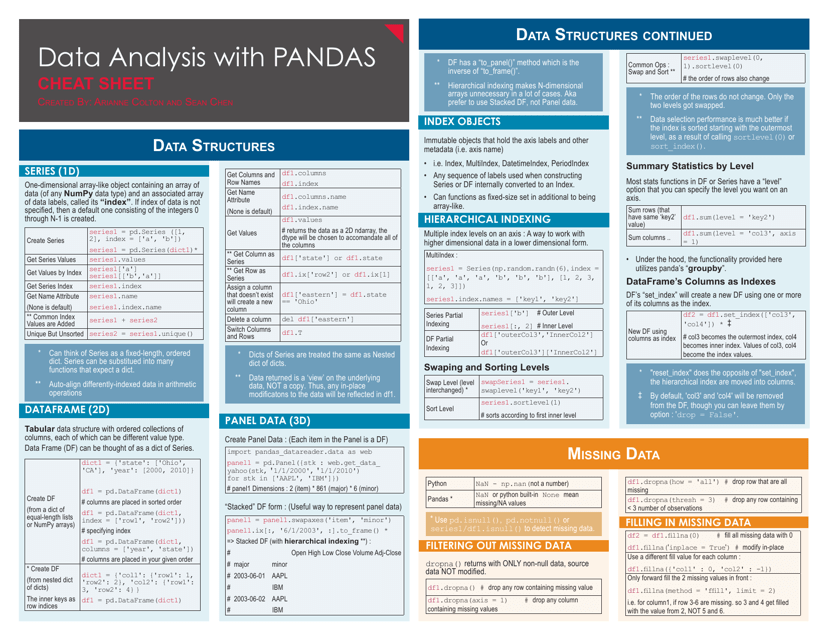
This cheat sheet provides an overview of data analysis using Pandas. It includes information on common functions, syntax, and techniques used in Pandas for analyzing and manipulating data.
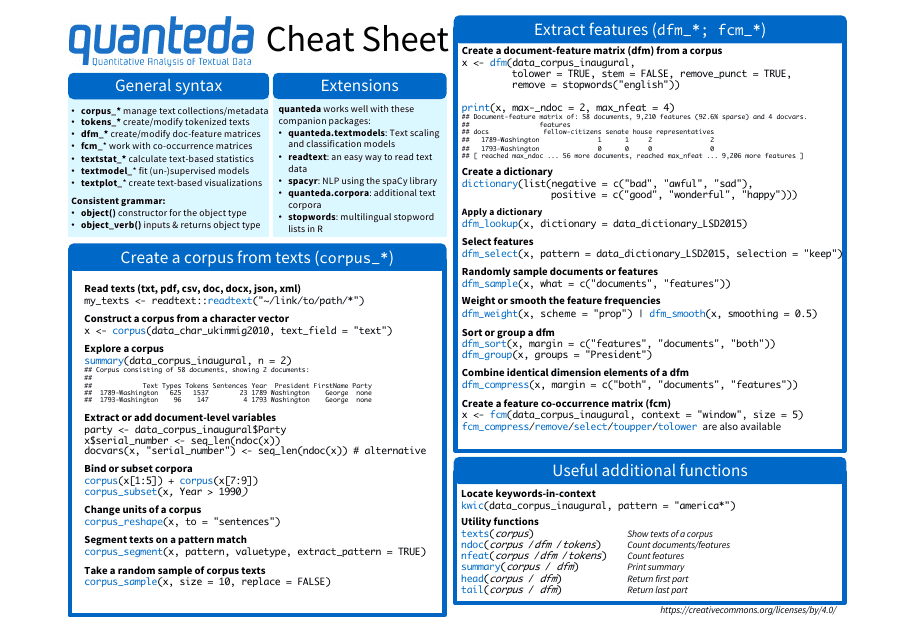
This document is a cheat sheet for using Quanteda, a software package for text analysis and natural language processing. It provides a quick reference for the various functions and commands available in Quanteda.
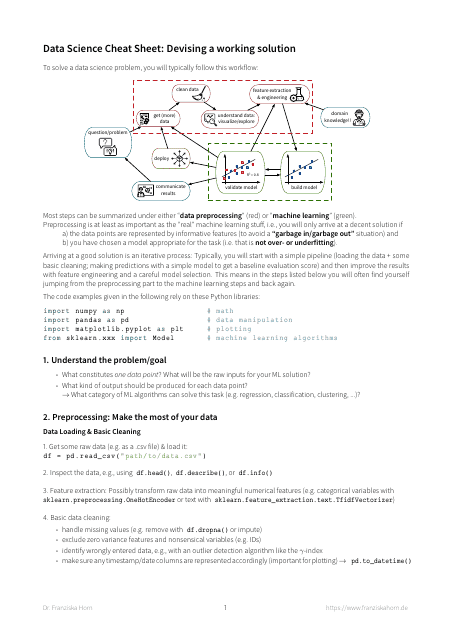
This cheat sheet provides a concise overview of problem analysis techniques used in data science. It includes key steps and strategies for understanding and defining data science problems, helping practitioners effectively analyze and solve real-world challenges.
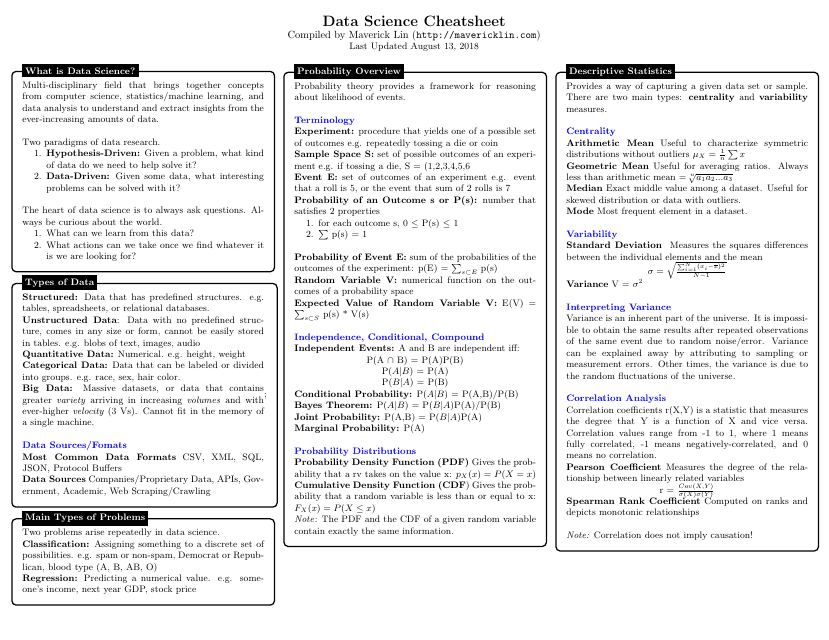
This document is a cheat sheet for data science, providing a quick reference guide for various concepts, algorithms, and techniques used in the field.
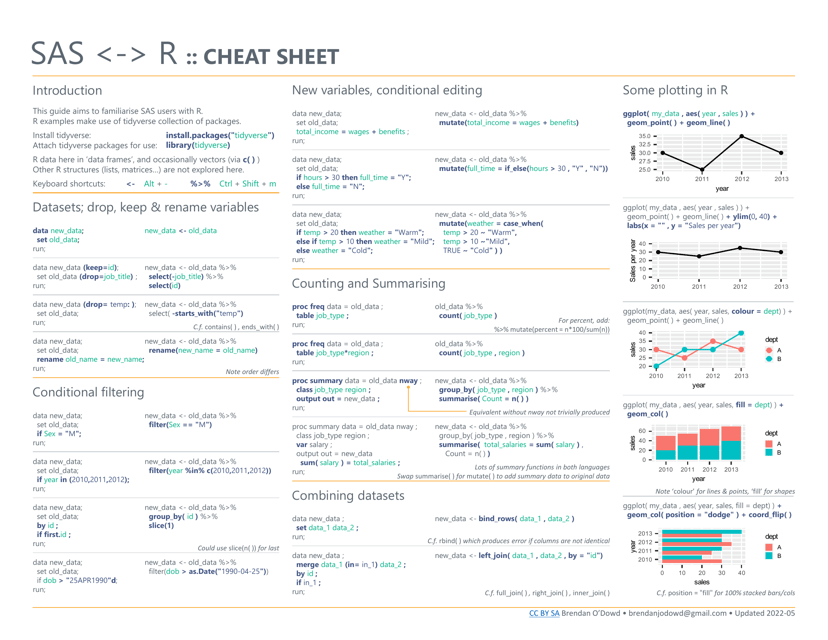
This document is a cheat sheet that provides helpful tips and commands for using SAS and R programming languages. It is a handy reference for those who work with data analysis and statistical modeling.
This type of document is a cheat sheet for the ggplot2 package, which is used for creating data visualizations in R programming language. The cheat sheet provides a quick reference guide for using different functions and options available in ggplot2.
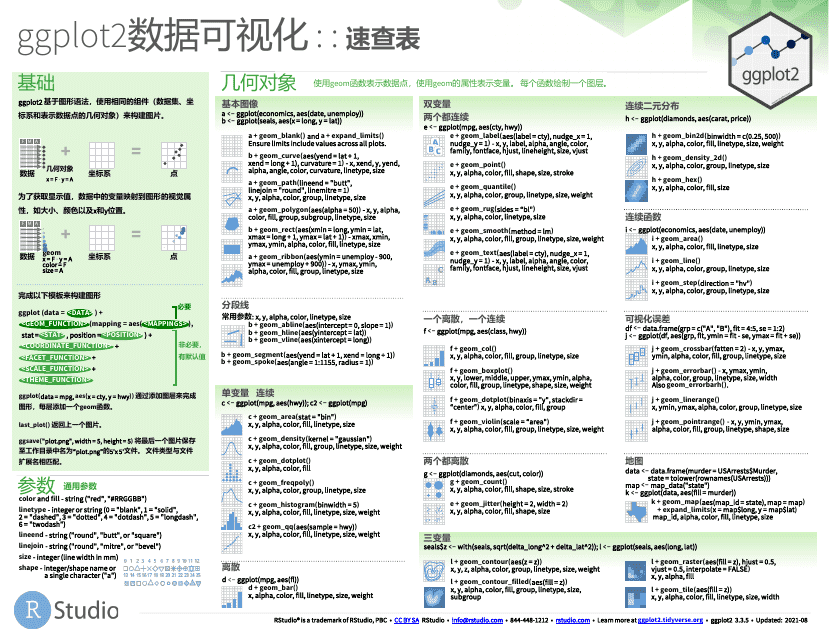
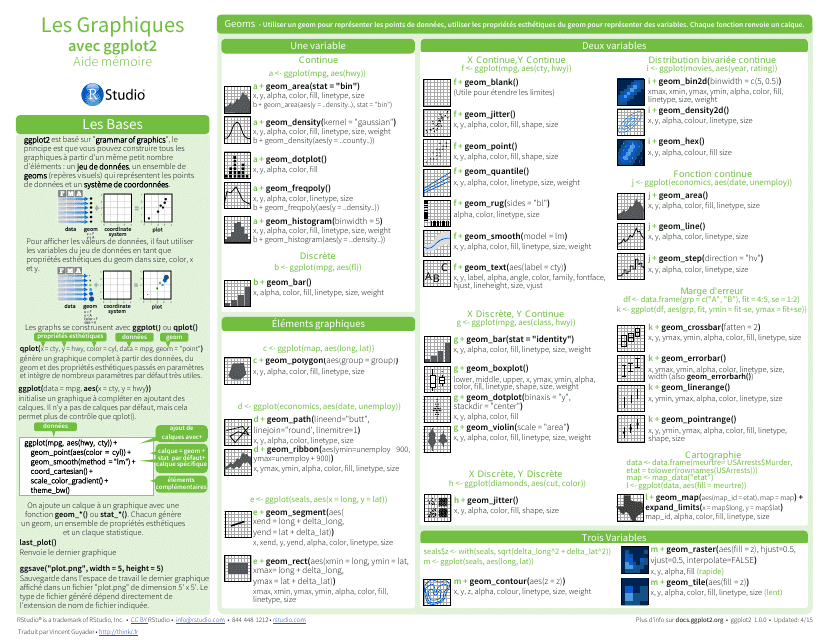
This document is a cheat sheet for using the Ggplot2 library in R, but it is written in French.
This document provides a quick reference guide for using the Tidyverse, a collection of R packages for data manipulation and analysis. It includes key functions and examples to help users navigate the Tidyverse ecosystem efficiently.
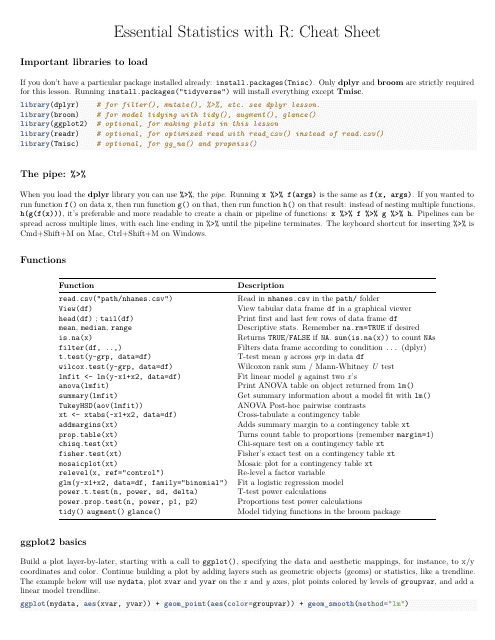
This cheat sheet provides essential statistics formulas and concepts for using the R programming language. It is a handy reference guide for statistical analysis in R.
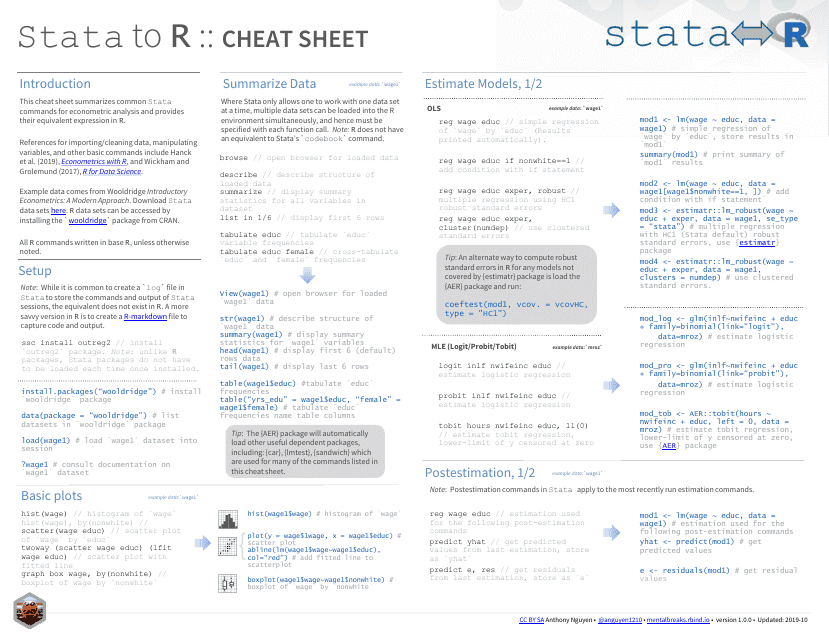
This document is a cheat sheet for Stata, a statistical software commonly used in research and data analysis. It provides a quick reference guide for key commands and functions in Stata.
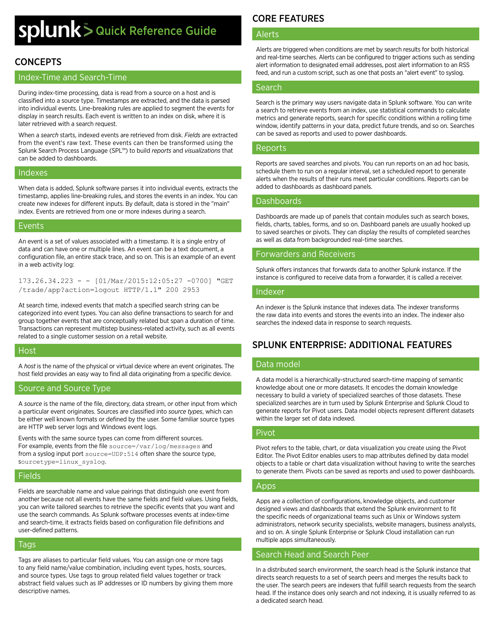
This document provides a quick reference guide for using Splunk, a platform for analyzing and visualizing machine-generated data. It includes key commands, search syntax, and tips for using Splunk effectively.
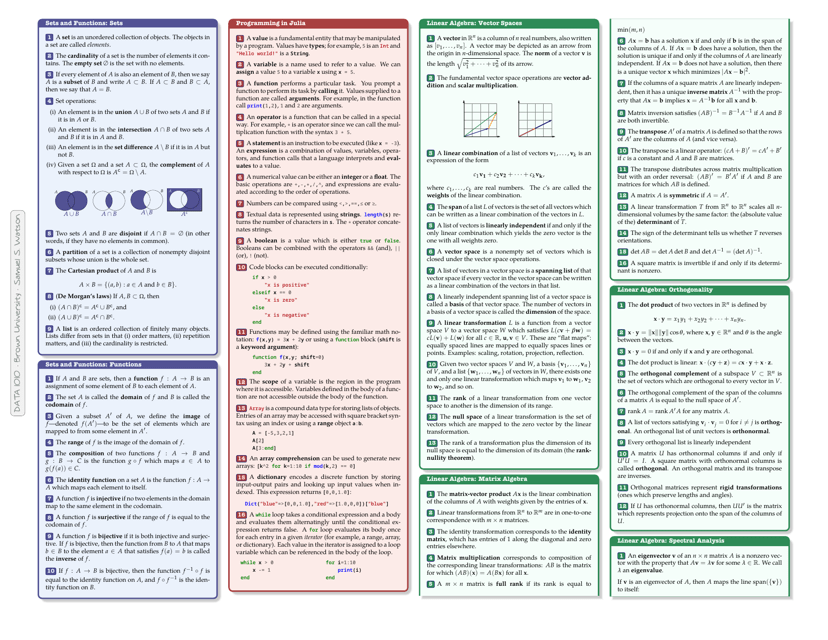
This cheat sheet provides key information and formulas related to Data 1010, a course offering an introduction to data analysis and statistics. It is a helpful resource for students studying this subject.
