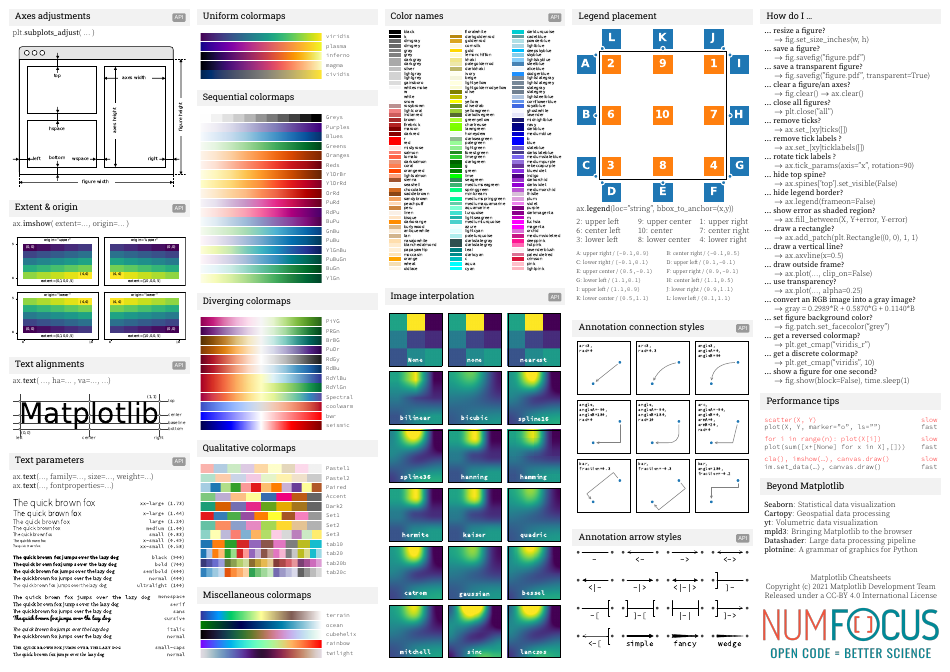
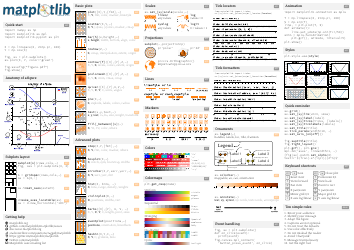
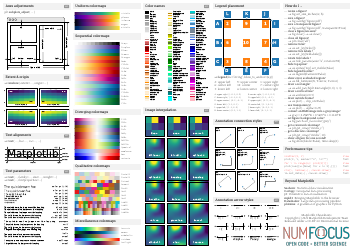
Matplotlib Cheat Sheet

The Matplotlib Cheat Sheet is a quick reference guide for using the Matplotlib library in Python. It provides a summary of the most commonly used functions and methods, along with examples, to help users create visualizations and plots efficiently.
FAQ
Q: What is Matplotlib?
A: Matplotlib is a data visualization library in Python.
Q: How can I install Matplotlib?
A: You can install Matplotlib using pip: 'pip install matplotlib'.
Q: What can I do with Matplotlib?
A: With Matplotlib, you can create various types of plots, such as line plots, bar plots, scatter plots, histograms, and more.
Q: What are the main components of a plot in Matplotlib?
A: The main components of a plot in Matplotlib are the figure, axes, and the plot itself.
Q: How can I create a line plot using Matplotlib?
A: You can create a line plot using the 'plot' function in Matplotlib.
Q: Can I customize the appearance of my plots in Matplotlib?
A: Yes, you can customize the appearance of your plots in Matplotlib by modifying properties such as colors, labels, titles, axes limits, and more.
Q: Can I save my plots as image files using Matplotlib?
A: Yes, you can save your plots as image files such as PNG or SVG using the 'savefig' function in Matplotlib.
Download Matplotlib Cheat Sheet
1
2