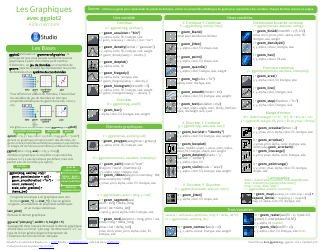
Ggplot 2 Cheat Sheet

The ggplot2 cheat sheet is a quick reference guide that provides a summary of the syntax and functionalities of the ggplot2 package in R. It helps users create visually appealing and customizable plots for data visualization.
FAQ
Q: What is ggplot2?
A: ggplot2 is a data visualization package in R.
Q: How can I install ggplot2?
A: You can install ggplot2 by running install.packages('ggplot2') in R.
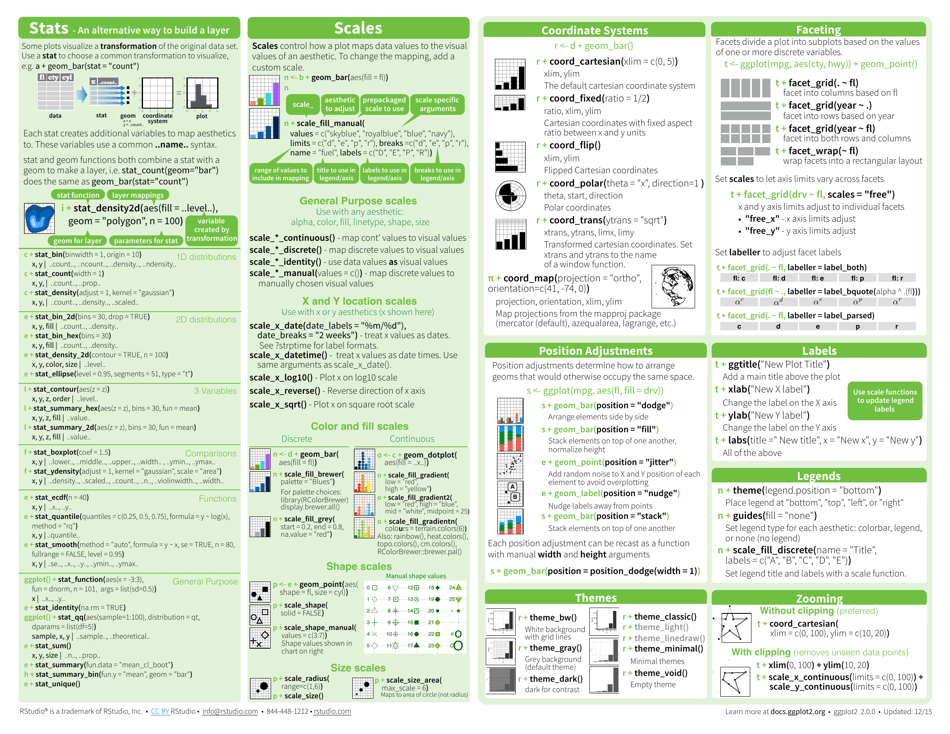
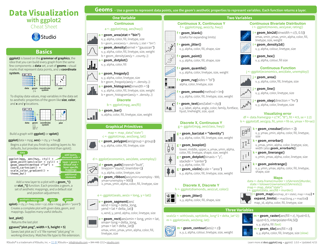
Q: What are the key components of a ggplot2 plot?
A: The key components of a ggplot2 plot are data, aesthetics, and geometries.
Q: How do I create a scatter plot using ggplot2?
A: You can create a scatter plot using ggplot2 by specifying the aesthetics (x and y variables) and the geometry (geom_point()).
Q: Can I customize the appearance of a ggplot2 plot?
A: Yes, you can customize the appearance of a ggplot2 plot by adding layers (e.g., geom_smooth()) and modifying the theme.
Q: Are there other data visualization packages available in R?
A: Yes, there are other data visualization packages available in R, such as lattice and ggvis.
Q: Is ggplot2 only available in R?
A: No, ggplot2 is also available in other programming languages like Python (through the ggplot library) and Julia (through the Gadfly package).
Download Ggplot 2 Cheat Sheet
1
2