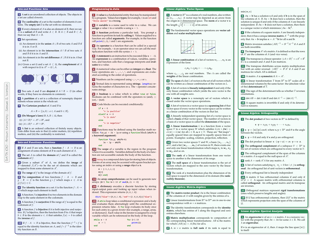
Ggplot2 Cheat Sheet - Data Visualization - Posit

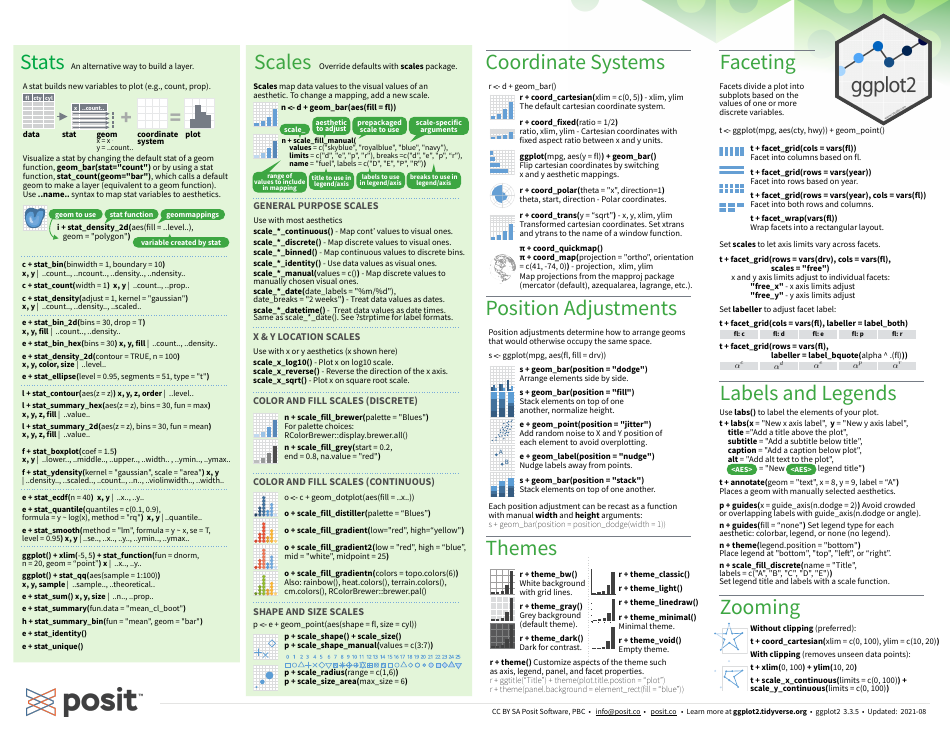
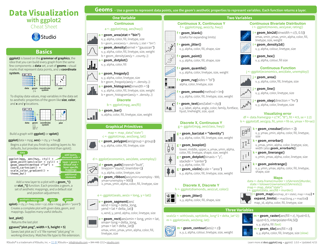
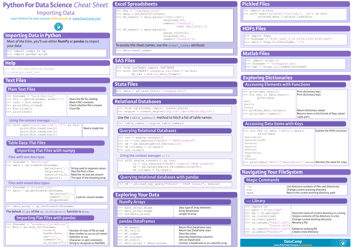
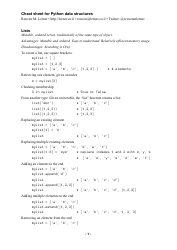
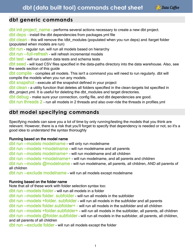
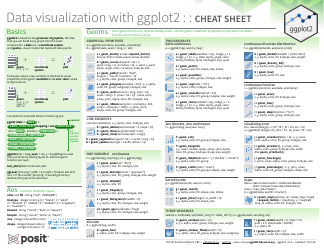
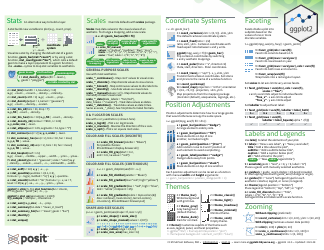
The Ggplot2 Cheat Sheet is a reference guide for the Ggplot2 data visualization package in R. It provides a summary of the functions and syntax used for creating various types of visualizations with Ggplot2.
FAQ
Q: What is ggplot2?
A: ggplot2 is a popular data visualization package in R.
Q: What is a cheat sheet?
A: A cheat sheet is a concise summary of key information or commands.
Q: What is data visualization?
A: Data visualization is the graphical representation of data to help understand patterns and trends.
Q: What can ggplot2 be used for?
A: ggplot2 can be used for creating various types of data visualizations, such as scatter plots, bar plots, and line plots.
Q: What are the benefits of using ggplot2?
A: Some benefits of using ggplot2 include its flexibility, ability to create visually appealing plots, and compatibility with other R packages.
Q: Is ggplot2 free to use?
A: Yes, ggplot2 is an open-source package and is free to use.
Q: Can ggplot2 only be used in R?
A: Yes, ggplot2 is a package specifically designed for the R programming language.
Q: Are there any alternatives to ggplot2?
A: Yes, some alternatives to ggplot2 include matplotlib in Python and plotly in R.
Q: Is ggplot2 widely used?
A: Yes, ggplot2 is widely used in the data science and visualization community.
Download Ggplot2 Cheat Sheet - Data Visualization - Posit
1
2