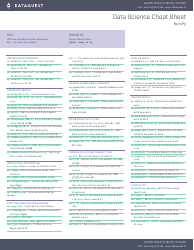
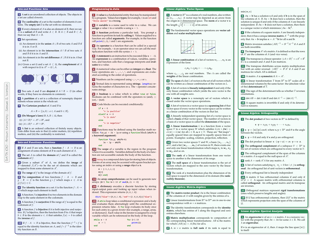
Ggplot2 Cheat Sheet - Data Visualization - Rstudio

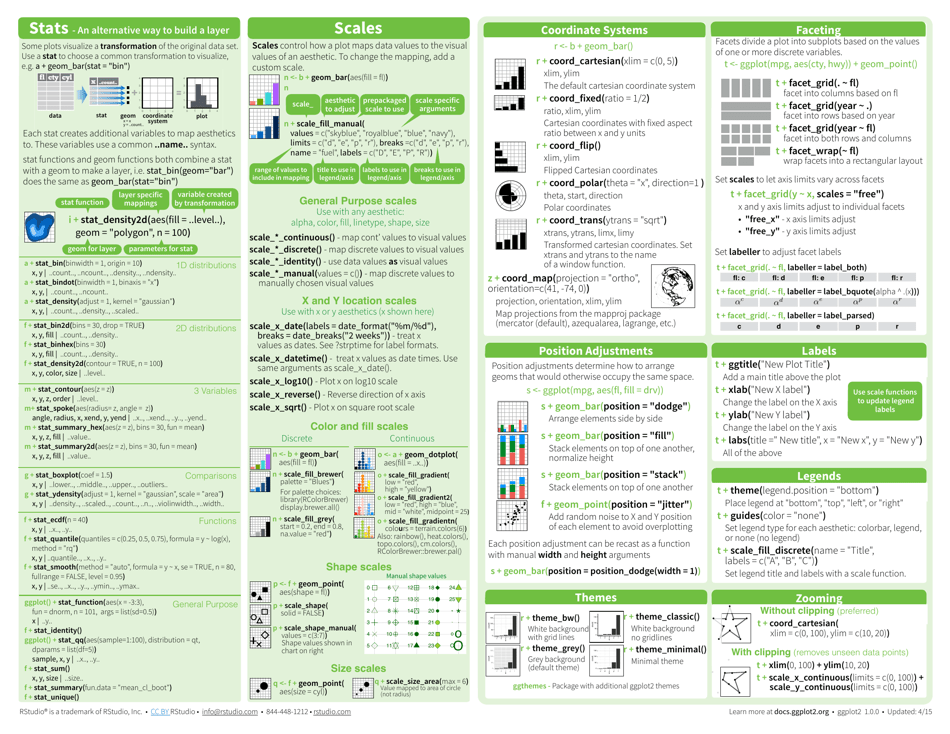
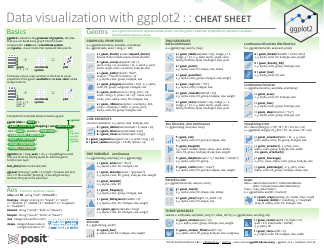
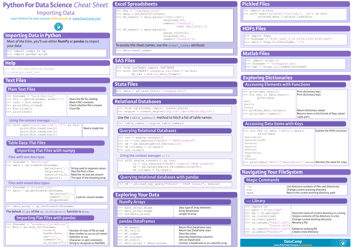
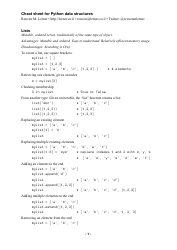
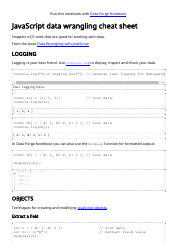
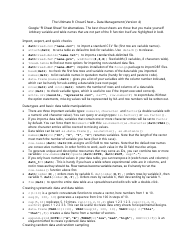
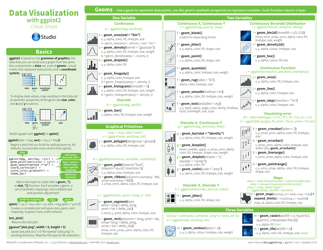
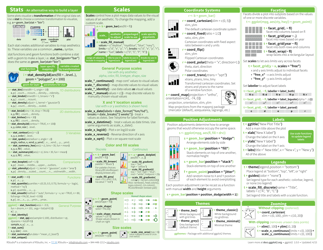
The Ggplot2 Cheat Sheet is a resource provided by RStudio that helps users of the R programming language with data visualization using the ggplot2 package. It provides a quick reference guide for creating different types of plots and customizing them in R.
The developers or maintainers of ggplot2 from RStudio would typically file the cheat sheet.
FAQ
Q: What is ggplot2?
A: ggplot2 is a data visualization package in R.
Q: What does ggplot2 do?
A: ggplot2 allows users to create beautiful and effective visualizations with R.
Q: What is a cheat sheet?
A: A cheat sheet is a quick reference guide that provides concise information on a specific topic.
Q: What is included in the ggplot2 cheat sheet?
A: The ggplot2 cheat sheet includes examples and syntax for creating various types of plots.
Q: Is ggplot2 free to use?
A: Yes, ggplot2 is an open-source package and is free to use.
Q: Do I need to know R to use ggplot2?
A: Yes, ggplot2 is a package in R, so some understanding of R is required to use it effectively.
Q: Are there any alternatives to ggplot2?
A: Yes, there are other data visualization packages available in R, such as base R graphics and lattice.
Q: Is ggplot2 compatible with other R packages?
A: Yes, ggplot2 can be used in conjunction with other R packages for data manipulation and analysis.
Q: Can ggplot2 be used for interactive visualizations?
A: Yes, ggplot2 can be combined with other packages, such as plotly, to create interactive visualizations.
Download Ggplot2 Cheat Sheet - Data Visualization - Rstudio
1
2