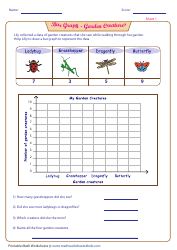
Generic Bar Graph Template

A Generic Bar Graph Template is a tool used to visually represent data in the form of bars. It is commonly used to compare different categories or groups of data and identify patterns or trends. It helps in presenting information in a clear and organized manner.
FAQ
Q: What is a bar graph?
A: A bar graph is a visual representation of data using bars of different heights or lengths.
Q: How is a bar graph constructed?
A: In a bar graph, the length or height of each bar represents the magnitude of a specific data category.
Q: What are the types of bar graphs?
A: Common types of bar graphs include vertical bar graphs and horizontal bar graphs.
Q: What is a vertical bar graph?
A: A vertical bar graph has bars that are displayed vertically, with the height of each bar representing the data value.
Q: What is a horizontal bar graph?
A: A horizontal bar graph has bars that are displayed horizontally, with the length of each bar representing the data value.
Q: How can bar graphs be used?
A: Bar graphs can be used to compare data values or track changes over time.