Free Graph Paper Templates
What Is Graph Paper?
Graph Paper refers to lined paper that contains a pattern with lines, usually straight ones, to create a grid of small squares or boxes. Whether you are looking for the right handwriting medium to teach your children or students how to place letters, words, and sentences on the page, creating custom embroidery patterns for personal use and for sale, or choosing a tool that will contain mathematical drawings, consider using custom Graph Paper you get to personalize to meet your needs.
For a full list of Graph Paper templates please check out our library below.
Graph Paper Template Types
- 1 Inch Graph Paper. Most often featured in school projects, this kind of lined paper will keep the student's writing straight guiding them and improving their skills;
- 1/2 Inch Graph Paper is a popular choice among young kids, artists, and diarists - perpendicular lines help them save space and keep their notes or art neat;
- Blank Bar Graph Paper. Use this template to collect and display various data you learn during the research or through a survey;
- Brick Stitch Graph Paper. Work on this Graph Paper template to create a visually striking work of art you later replicate with beads or thread;
- Cross Stitch Graph Paper will let you make your pattern from scratch - come up with a needlework pattern for beginners and experts in this wonderful craft;
- Graph Paper With Axis. Instead of drawing axes every time you need to depict a graph or grid, measure data right away with the ready-made system of coordinates;
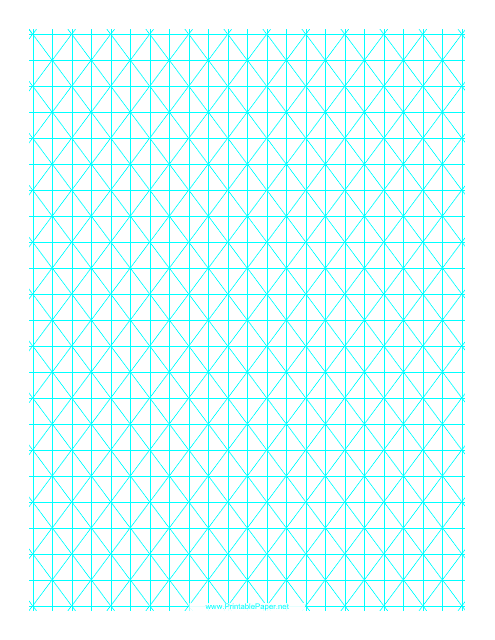
- Half Square Triangle Paper is often used in quilting - generate your own graphic design and turn it into a stencil for your handmade project;
- Hexagon Graph Paper. If you are interested in geometric patterns made out of six-side shapes, this is the lined paper for you;
- Isometric Paper will work nicely for three-dimensional designs introducing depth to the drawing you make with the help of editing software;
- Log Paper. A favorite among math students, this type of graph paper will allow you to create a graph of logarithmic function without additional tools like a calculator;
- Peyote Stitch Graph Paper. Peyote stitch is a fun weaving technique beaded bracelets and necklaces are based on - follow the patterns to make your own jewelry;
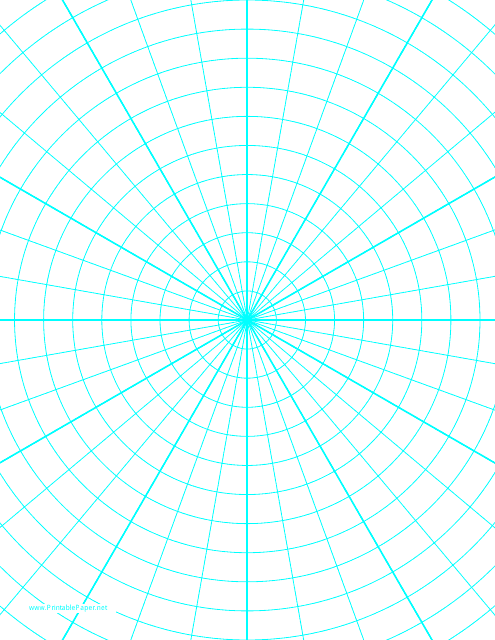
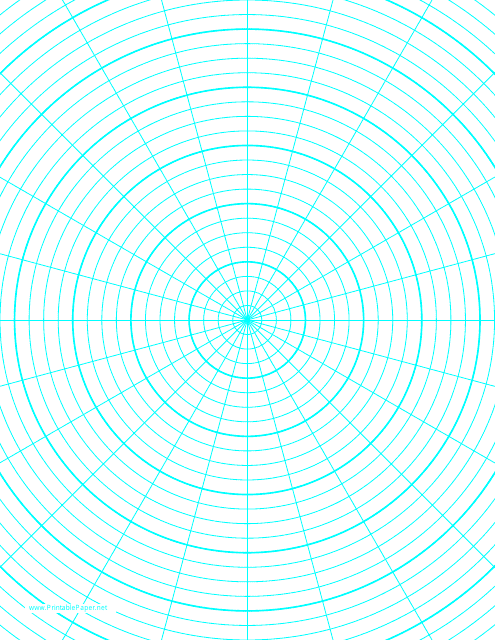
- Polar Graph Paper can be transformed into a visual diagram with axes that meet at a central point and show different values assigned to them.
How to Use Graph Paper?
Here are some tips that will show you how to implement Graph Paper in your work, studies, and hobbies:
- Print out as many sheets with the pattern as you want, staple them together, fold them in half, and add a cover - this is how you can make a Graph Paper notebook. It can be used for sketching, writing down mathematical equations, or simply journaling - when you have blank sheets of paper, you often use more space to write down your thoughts so this is a good way to organize your memories of the day properly.
- Develop your imagination further by working on Graph Paper art . Just like pixel art, it remains relevant - whether you are making your first steps in graphic design or working on a cross stitch pattern you will later recreate with the help of thread and fabric, you need to have a pattern first. Besides, this kind of hobby can be turned into a source of income, and the patterns you draw on the Graph Paper will be the first step towards that.
- Add more structure to your science classes by using Graph Paper to do your homework and pass tests - for instance, Hexagon Graph Paper will let you draw organic molecules faster while any kind of Graph Paper that has a pre-drawn axis can be used by a student whose task is to solve math problems. Professionals should also look into the benefits of this instrument - for example, engineering Graph Paper has long helped engineers to explore the strengths and weaknesses of the upcoming project and identify what may be wrong with their planning.
Still looking for a particular template? Take a look at the related templates below:
Documents:
315
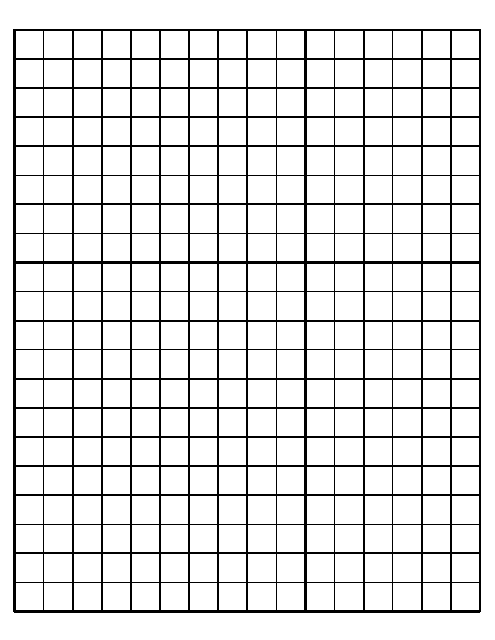
This type of document is used for drawing math graphs and solving equations on a grid. It is designed with a black and white grid pattern to aid in visualizing and organizing mathematical data.
Note: SEO optimized answer is "Black and white math graph paper is used for drawing math graphs and solving equations on a grid. It features a black and white grid pattern to aid in visualizing and organizing mathematical data."
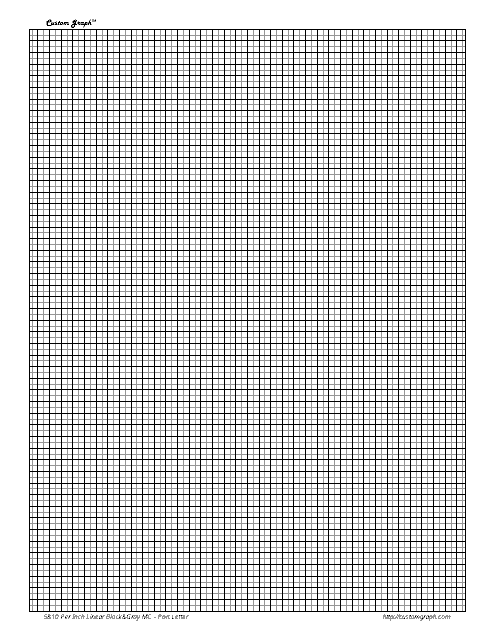
This template is a type of graph paper with a black grid that has 10 squares per inch. It is useful for various mathematical and technical drawings.
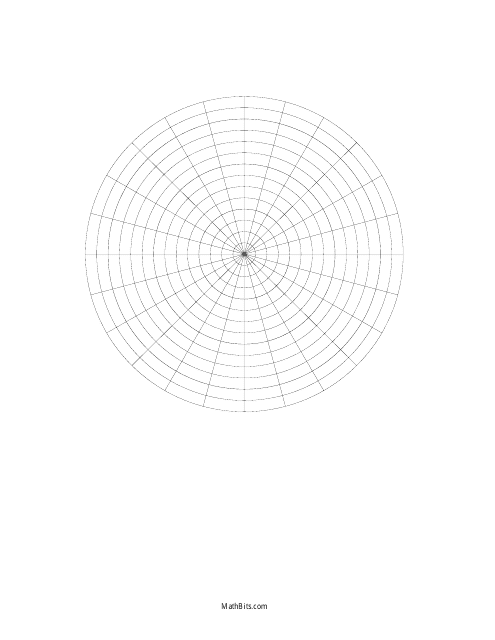
This document is a printable template often used by mathematicians, engineers, and students to plot polar coordinates or functions in the form of a black and white grid.
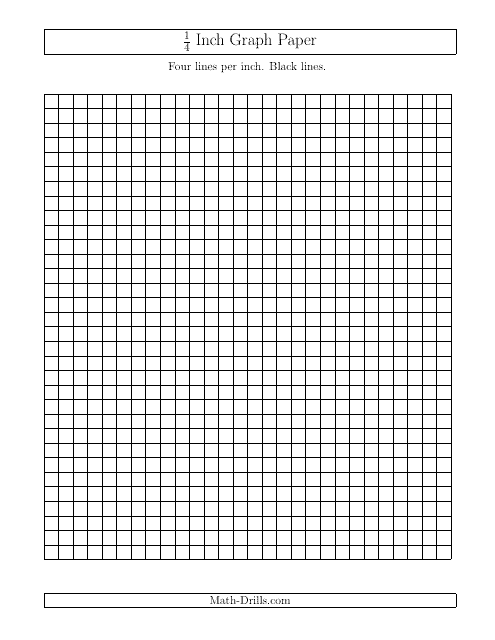
This document provides a template for graph paper with 1/4 inch lines, enabling you to create neatly lined graphs and charts.
This document is a black triangle dot paper template. It is used for creating designs or organizing information using a grid of triangles with dots in the corners.
This template is used to create bar graphs for various purposes. It provides a basic layout for organizing data and visualizing trends using bars of different lengths. Customizable and easy to use.
This type of document is large green half-square triangle paper used for quilting and other sewing projects. It is a convenient tool for creating accurate and symmetrical triangle shapes.
This type of document is a specialized paper used for creating half-square triangles with a green color.
This document is a template for cyan hypometric grid paper, which is commonly used for graphing or plotting mathematical functions and data. It features a grid pattern with cyan lines that are spaced at regular intervals to assist with accuracy and organization.
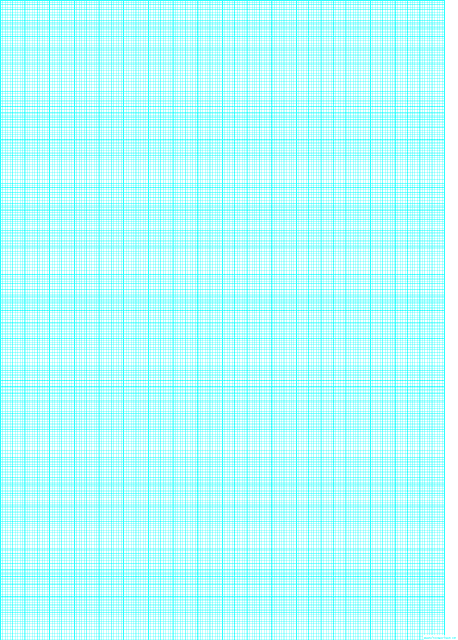
This type of document is a template for cyan-colored graph paper. It can be used for drawing or plotting various mathematical functions or creating graphs.
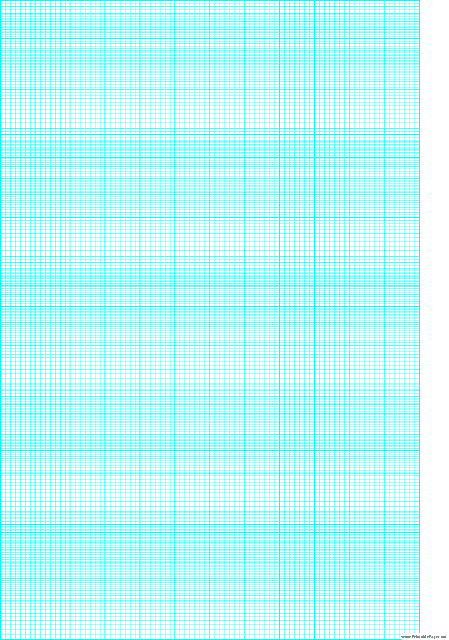
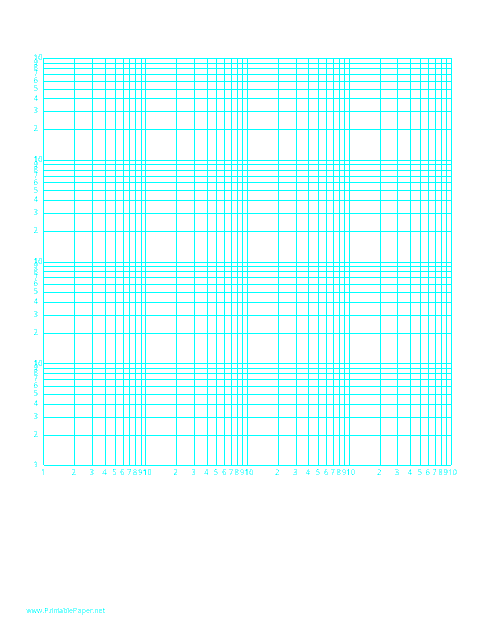
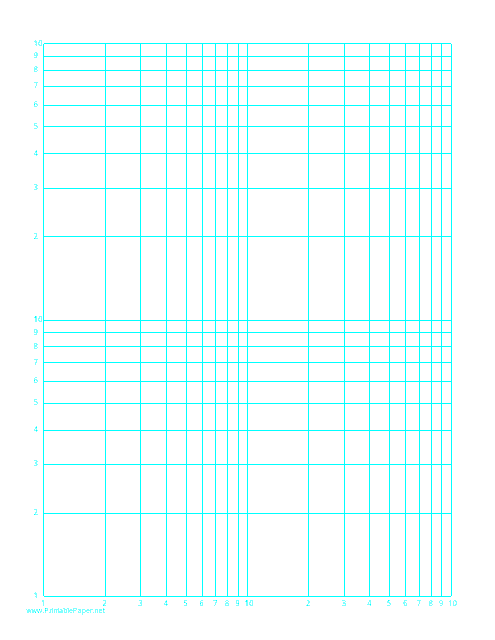
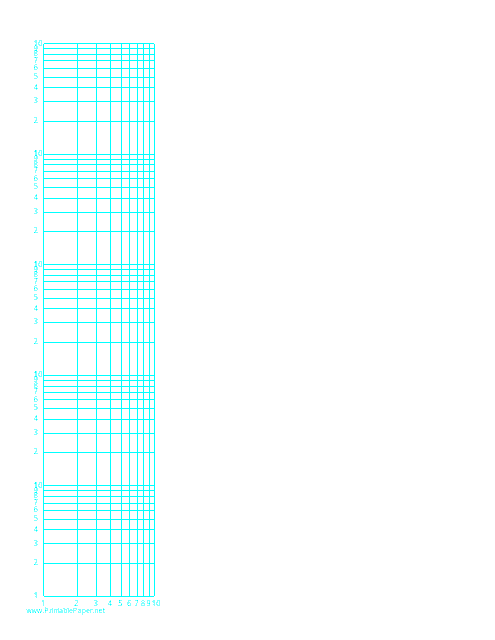
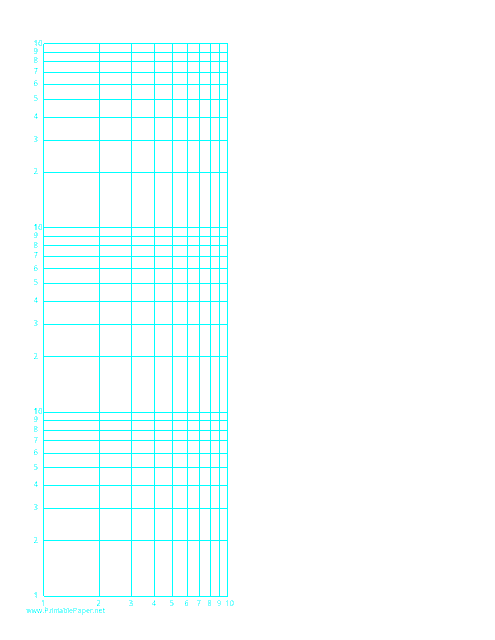
This type of document is a cyan semi-log paper template with 18 divisions. It is commonly used for creating graphs and charts that require a logarithmic scale.
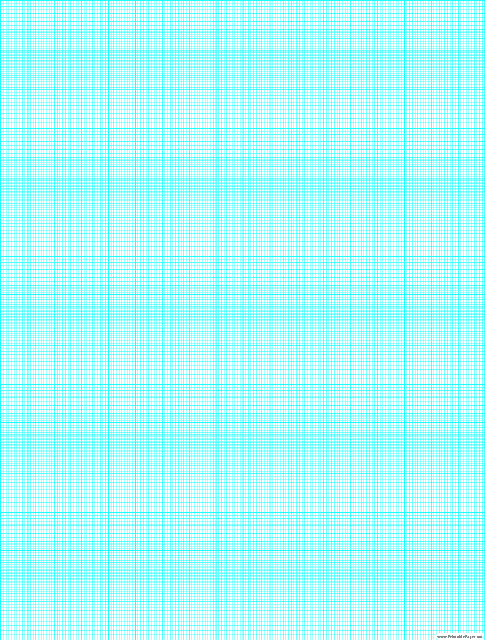
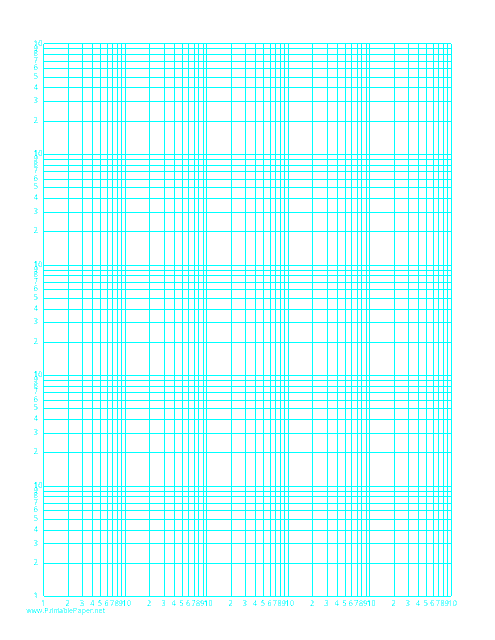
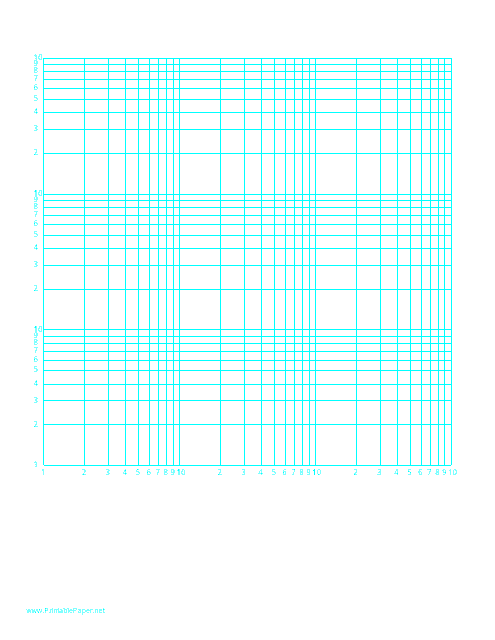
This template is used for creating Cyan Semi-log Paper with 36 divisions by 3-cycles.
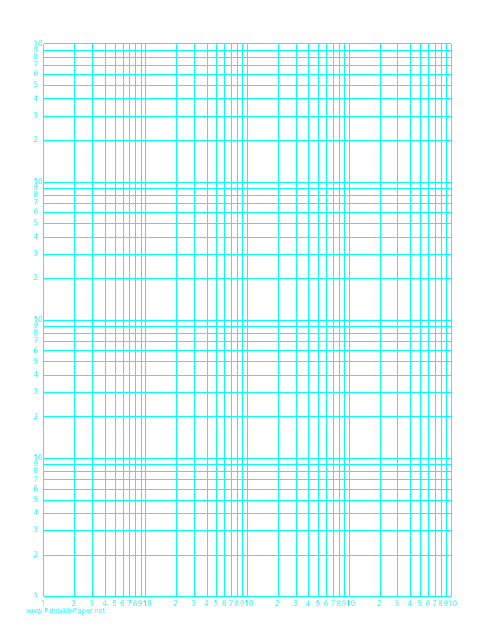
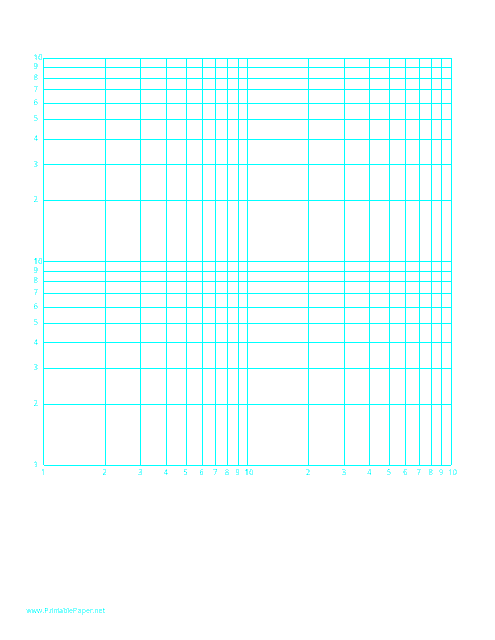
This document is a cyan semi-log paper template with 12 divisions by 5 cycles. It is used for plotting exponential and logarithmic functions in a graphical format.
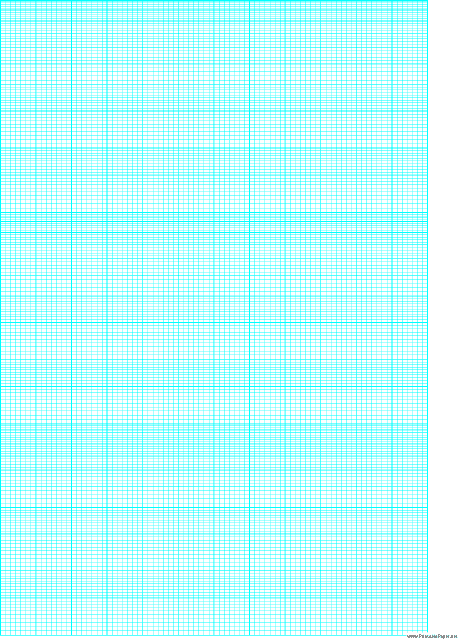
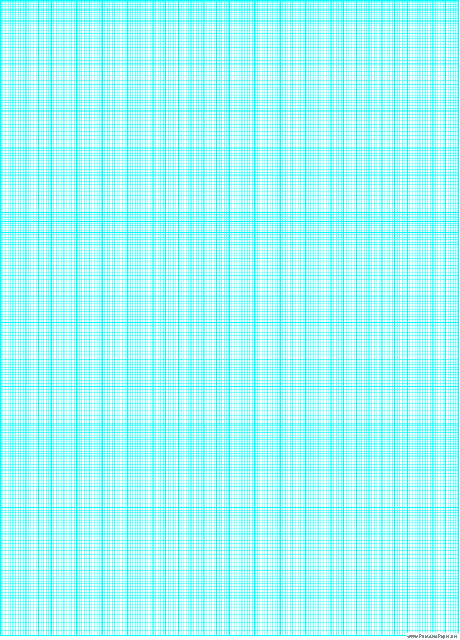
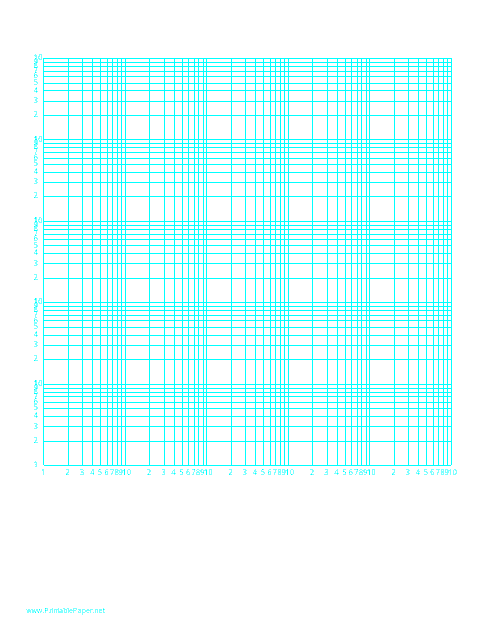
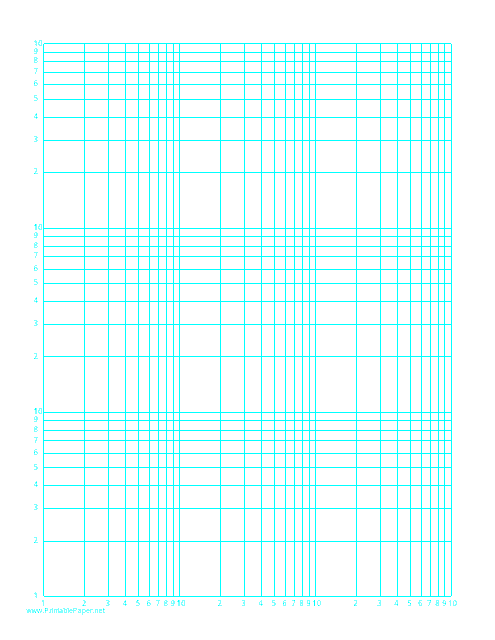
This document is a template for cyan semi-log paper with 12 divisions by 3-cycles. It is used for graphing data that spans a wide range of values.

This document is a printable graph paper with concentric circles laid out for plotting polar coordinates. The circular design with incremental degrees, make it easy for mathematicians, engineers and artists to create complex structures, designs or solve mathematical problems. Featured in blue color, it brings an elegant look enhancing its usability.
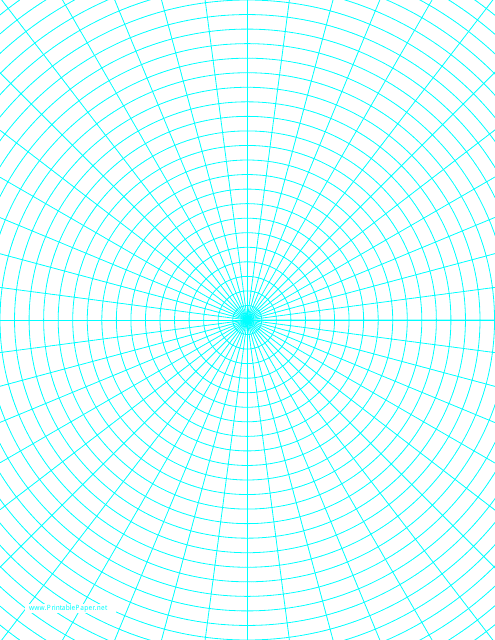
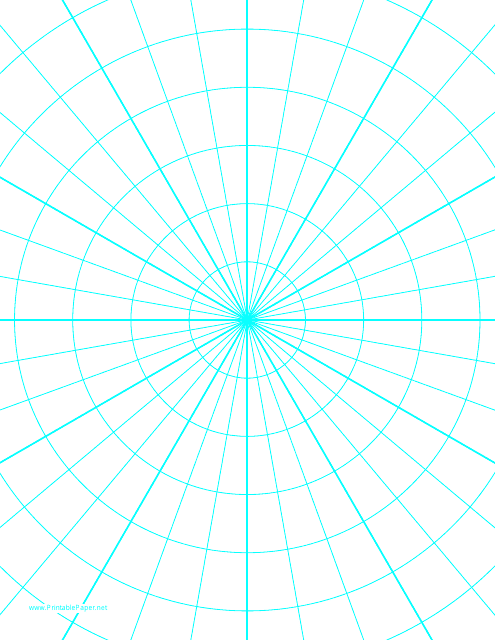
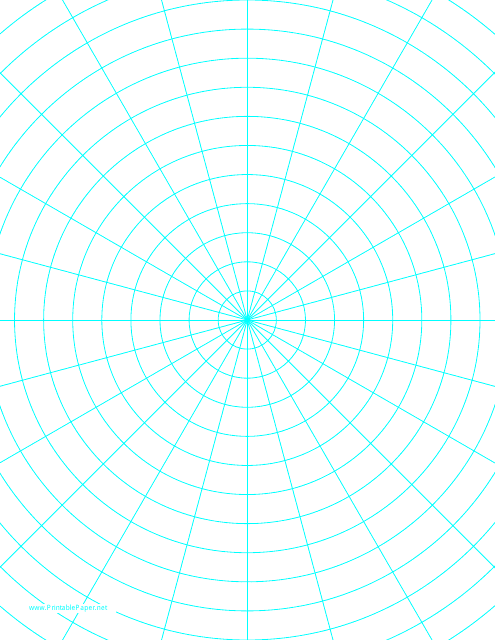
This document includes printable polar graph paper that is larger than normal size. Ideal for plotting polar coordinates, representing mathematical functions and making detailed diagrams used in fields like physics or engineering.
This type of document provides large-sized polar graph paper used for plotting polar coordinates, for the creation of pie charts, or circle graphs, to aid in understanding geometrical and trigonometric concepts in mathematics. Ideal for students, engineers, and mathematicians.
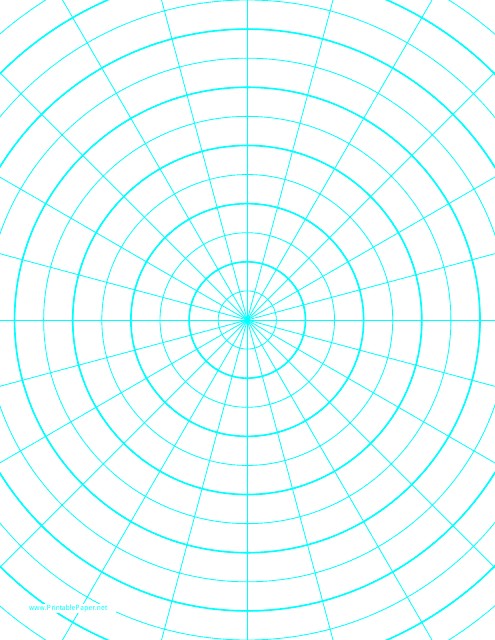
This type of document provides specialized paper used for graphing polar coordinates, commonly applied in mathematics or various engineering fields for plotting circular or radial data.
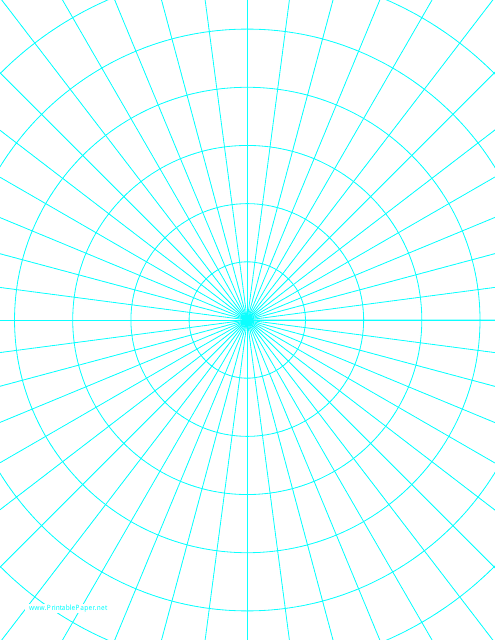
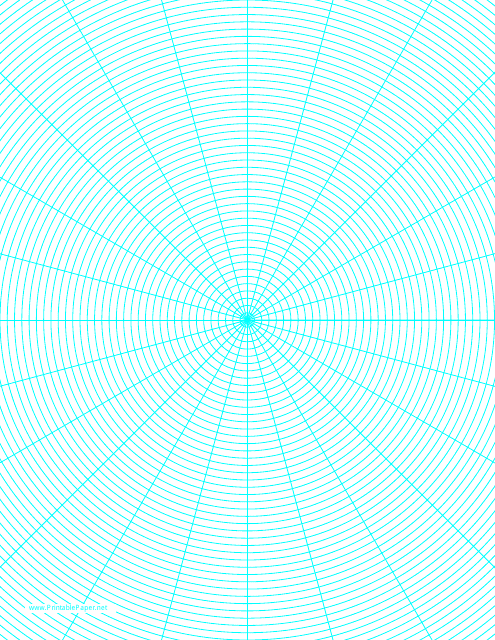
This type of document provides printable ray-style polar graph paper, typically used for creating circular or angle-based mathematical diagrams and plots. It's ideal for students, teachers or anyone needing to create complex patterns related to polar coordinates.
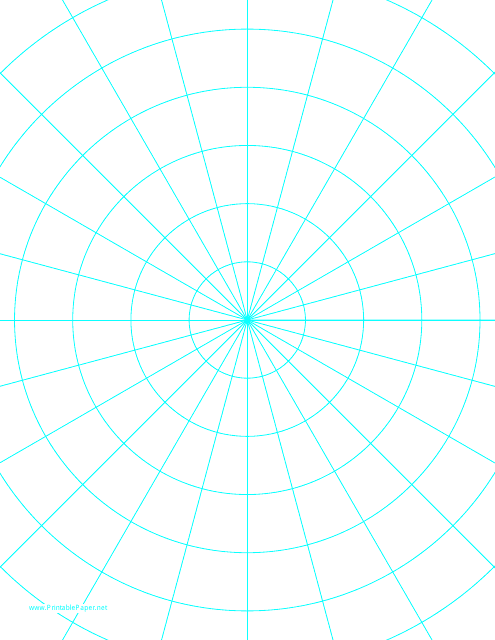
This document is a printable template primarily used by mathematicians, engineers, and students for plotting polar coordinates, which are two-dimensional systems associated with angles and distances.
This type of document is generally utilized in mathematics, specifically for graphing polar coordinates, equations, and curves. It features radial distance and angles on a grid tailored for the task.
This type of document provides a printable template of little polar graph paper. It's primarily used in mathematics to draw polar coordinates and complex mathematical calculations.
This document typically includes printable or digitally interactive graph paper featuring concentric circles divided into small arcs or 'pie wedges' helpful in plotting polar coordinates, functions, and experimental data in mathematical, engineering, and physical sciences studies.
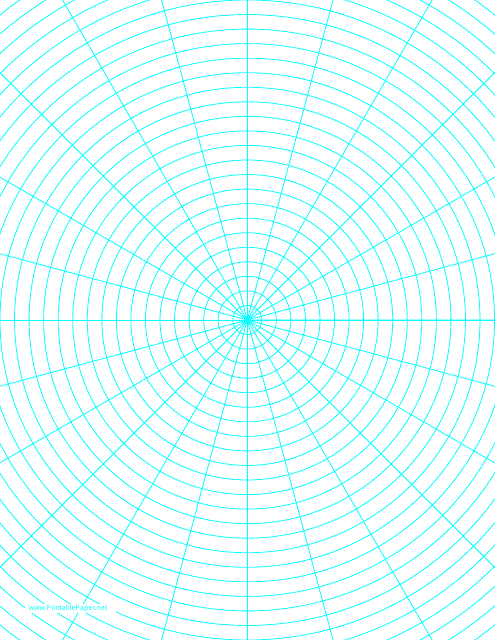
This document provides a template for a polar graph paper, which is used in mathematics, physics, engineering and other related fields for data representation in polar coordinates. It's especially useful for plotting angles in degrees or radians.
This document is a template for cyan polar graph paper. It is used for plotting points and drawing graphs with polar coordinates.
This document provides a printable version of logarithmic graph paper with both horizontal and vertical axes spanning five decades. Ideal for mathematical and scientific calculations where the scale of data spans several orders of magnitude. It is designed to fit on a standard letter-sized paper.
This document provides a printable template for a log-log graph paper. It features logarithmic scales on both horizontal and vertical axes, spanning five decades each, fitting on a standard letter-sized paper. Ideal for advanced mathematical and scientific plotting.
This document provides a grid paper template for a logarithmic scale plot. It features both horizontal and vertical axes, each divided into four decades, on a standard letter-sized paper. It is often used in fields such as engineering or mathematics for presenting data with wide ranges.
This type of document serves as a graphing tool with both horizontal and vertical axes in logarithmic scale. It is typically used in various scientific and engineering fields for representing data that cover a large range.
This document is a printable template for log-log graph paper designed on a letter-sized layout. It features both a logarithmic horizontal and vertical axis, each spanning three decades, and is useful for a variety of scientific and engineering calculations.
This document provides a grid for plotting exponential data as per logarithmic scale. It's designed with logarithmic horizontal and vertical axes each spanning three decades. It's beneficial for visualising multiplicative changes or variations.
This type of document provides a printable format of a log-log graphing paper featuring a logarithmic horizontal axis (two decades) and logarithmic vertical axis (two decades). Ideal for plotting data with wide ranges of values in a compact way.
This type of document is a specific type of graphing paper that enables data presentation on a scale that displays multiple orders of magnitude. It is utilized in various fields, including engineering and mathematics. The horizontal and vertical axis each represents two decades in a logarithmic scale.
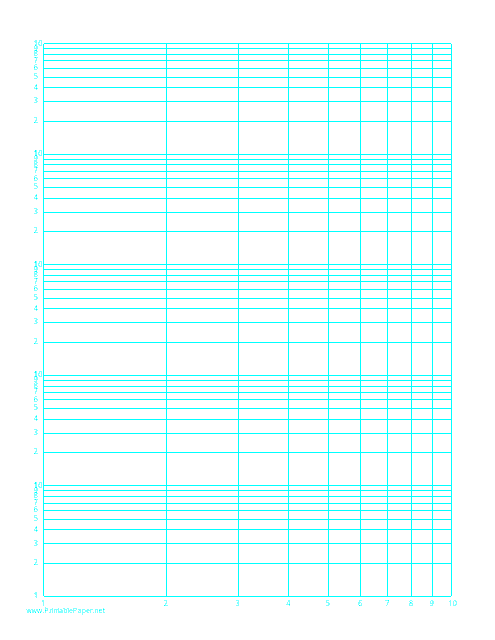
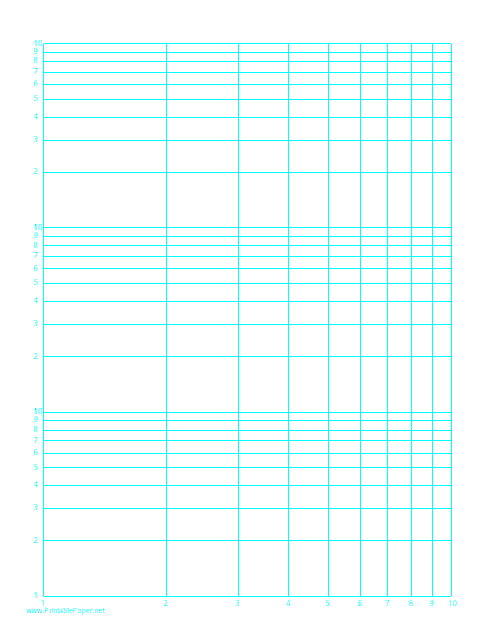
This type of document is designed for mathematical and scientific calculations. It comes with a logarithmic scale on both the horizontal axis (one decade) and vertical axis (five decades) on a standard letter-sized paper. Ideal for representing wide-ranging quantities.
This type of document is utilized for drawing graphs with a wide-ranging scale. It's a special type of paper which allows plotting of functions on both horizontal and vertical axes, displaying one decade on the horizontal axis and five decades on the vertical axis. Suitable for scientific and engineering presentations.
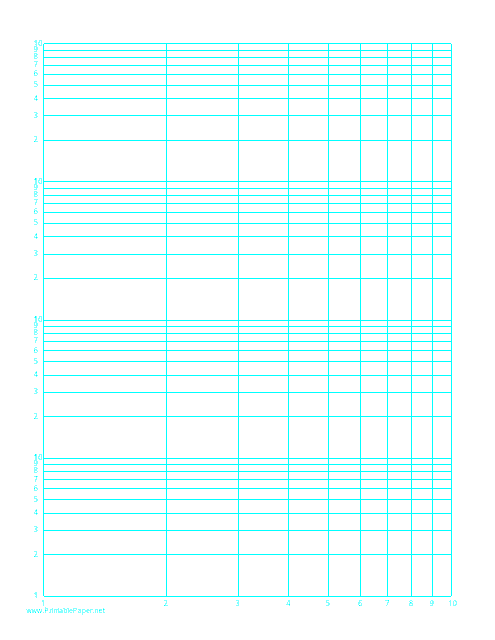
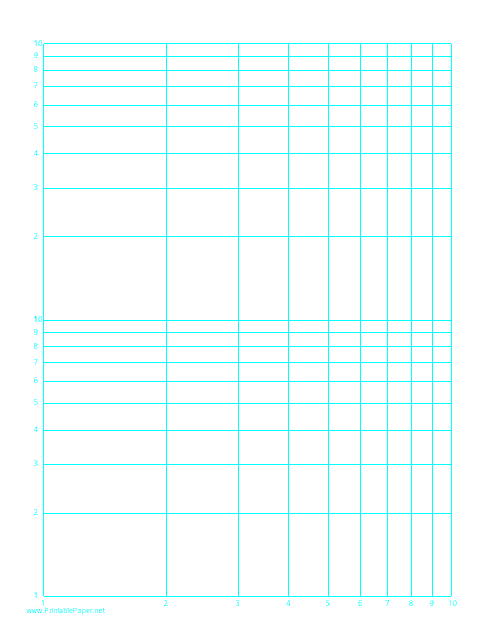
This template is typically used for creating and printing log-log graph paper with specified scaling of logarithmic horizontal axis (one decade) and logarithmic vertical axis (four decades) on the standard letter-size paper. The customizable feature of the template can be used in various applications such as in scientific research, engineering, and mathematical calculations.
This type of document is a printable template for graphing purposes. It features a logarithmic scale on both horizontal and vertical axes, the former covering one decade and the latter encompassing four decades, to plot exponential and rapid-growth data. It's often used in scientific and engineering disciplines.
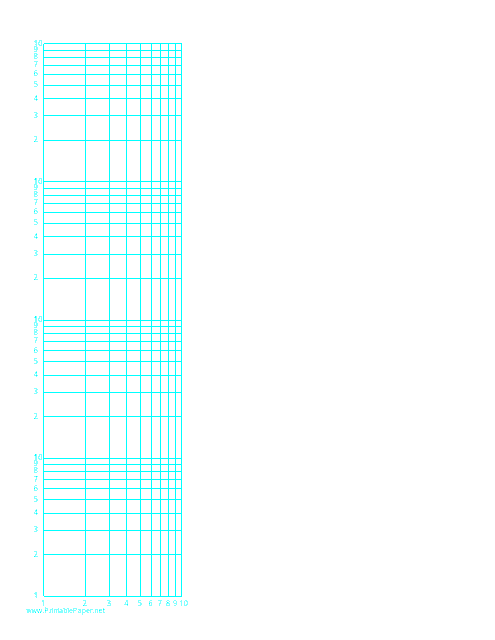
This document is used for plotting data on a logarithmic scale. It is essential for fields like engineering and physics where one needs to illustrate data that changes exponentially or follows a power law. It comprises a horizontal axis spanning one decade and a vertical axis spanning three decades.
This document is a customizable template for log-log graph paper. It features a logarithmic scale on both the horizontal axis that spans one decade and the vertical axis spanning three decades. Ideal for plotting data with wide-ranging values in scientific and engineering disciplines.
This document is a cyan log-log paper template with a logarithmic horizontal axis spanning one decade and a logarithmic vertical axis spanning two decades. It is used for plotting data with logarithmic scales.
