Logarithmic Graph Paper Templates
Logarithmic Graph Paper: A Handy Tool for Exponential Analysis
Looking for a way to effectively analyze data with exponential patterns? Look no further than logarithmic graph paper. Also known as logarithmic graph paper templates or printable logarithmic graph paper, this collection of graph paper templates is an essential tool for individuals in various fields.
Logarithmic graph paper is designed to accommodate data that follows a logarithmic scale, making it ideal for exponential analysis. Unlike regular graph paper, which uses a linear scale, logarithmic graph paper evenly spaces values on a logarithmic scale, allowing for accurate representation of exponential growth or decay.
With logarithmic graph paper, you can easily plot data with a broad range of values. Each template within this collection offers different scales, ranging from one to ten decades, providing flexibility to meet your specific needs. Whether you are analyzing scientific data, conducting financial analysis, or working on engineering projects, logarithmic graph paper will simplify your data visualization and improve your understanding of exponential patterns.
Choose from a variety of logarithmic graph paper templates, each with its own unique features. From log-log paper with logarithmic horizontal and vertical axes to templates with equal scales, you'll find the perfect template to suit your needs. Whether you prefer a classic letter-sized paper template or opt for vibrant colors like orange or blue, these logarithmic graph paper templates offer versatility and convenience.
Printable logarithmic graph paper can be easily downloaded or printed, allowing you to have a physical copy whenever and wherever you need it. Whether you're in the office, field, or classroom, the convenience of having logarithmic graph paper at your fingertips cannot be overstated.
So, if you're ready to enhance your analysis of exponential data, explore our collection of logarithmic graph paper templates. Whether you're new to logarithmic scales or an experienced data analyst, our templates will simplify the visualization and interpretation of exponential patterns. Start using logarithmic graph paper today and elevate your understanding of exponential growth and decay.
Documents:
12
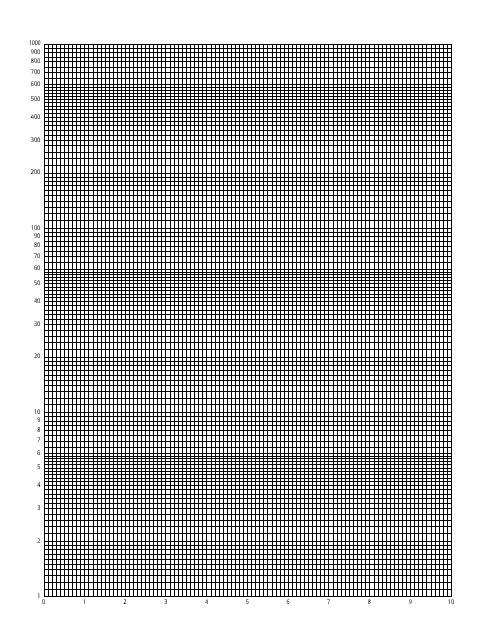
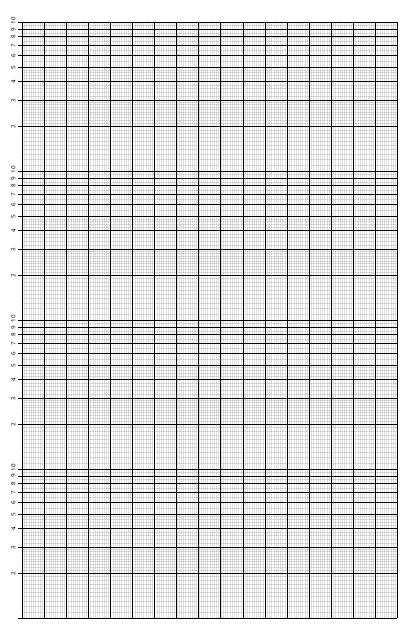
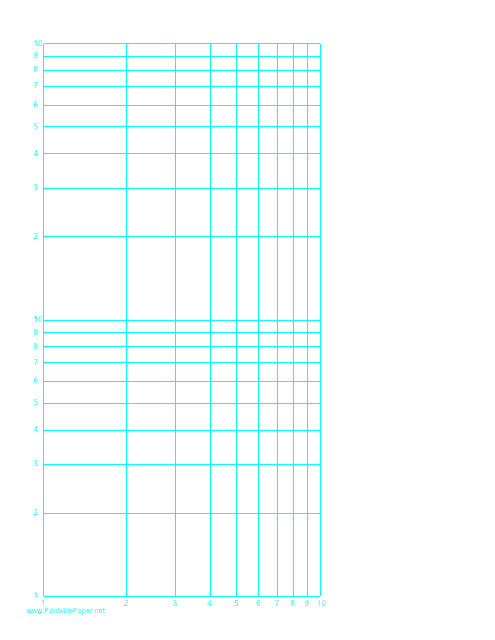
This type of document is designed for mathematical and scientific calculations. It comes with a logarithmic scale on both the horizontal axis (one decade) and vertical axis (five decades) on a standard letter-sized paper. Ideal for representing wide-ranging quantities.
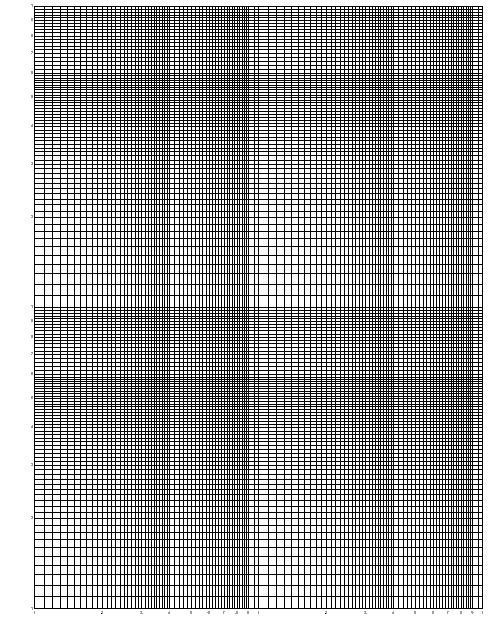
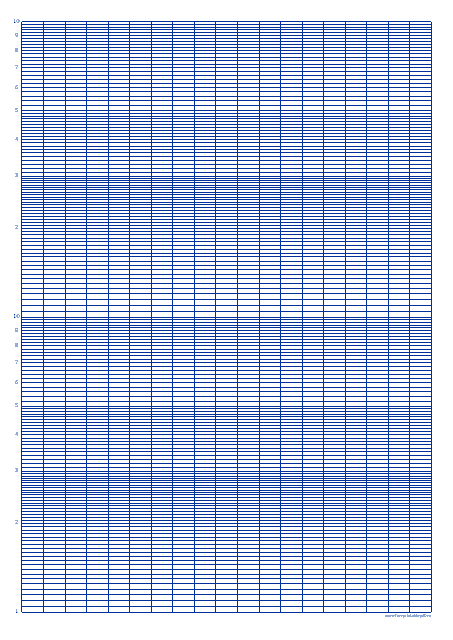
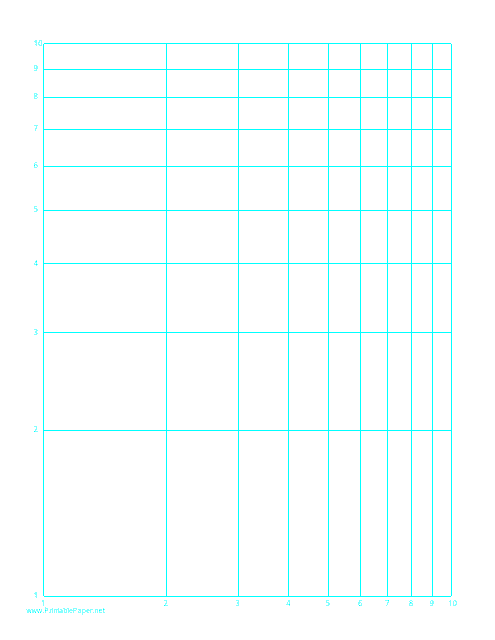
This template is designed for creating graph paper with logarithmic scales on both the horizontal and vertical axes. It is suitable for plotting functions with exponential growth or decay, auditory and seismic data, or any other measurements that cover a large range of values on a letter-sized paper.
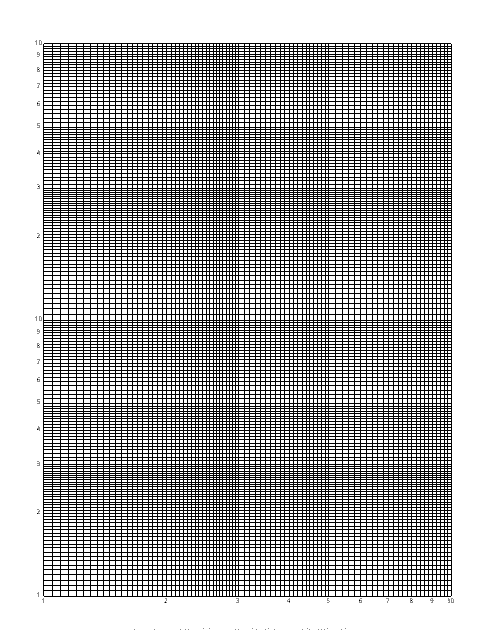
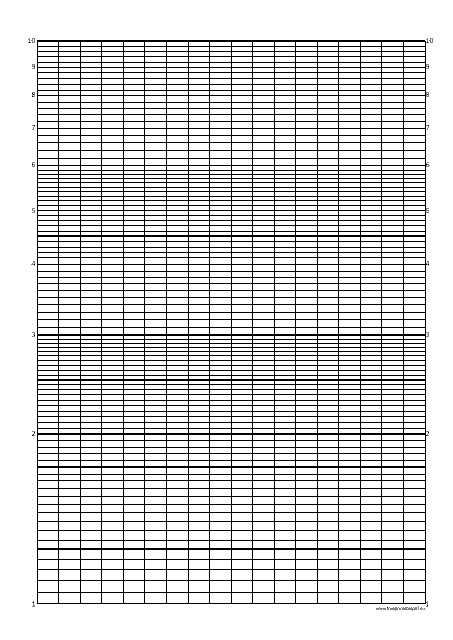
This template is designed for plotting complex data on a logarithmic scale for both horizontal and vertical axes. Providing predefined scales, it's perfect for technical and scientific uses, especially when dealing with extensive data ranges or exponential growth or decline.
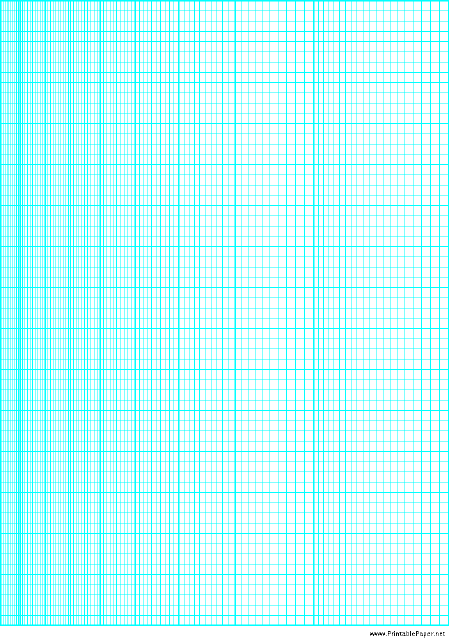
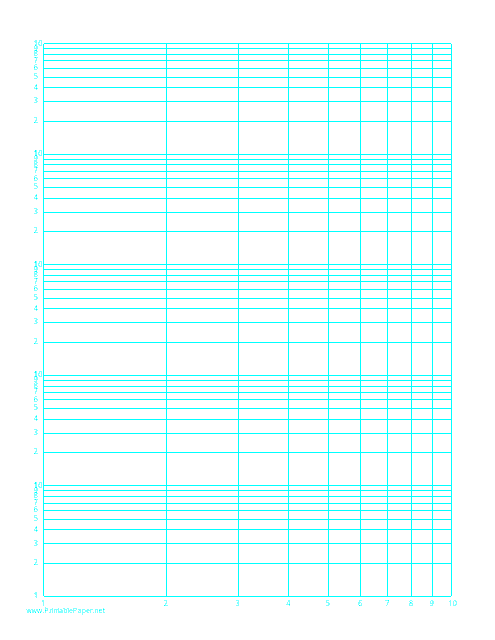
This document provides a template of cyan semi-log paper, commonly used for graphing data with a logarithmic scale.
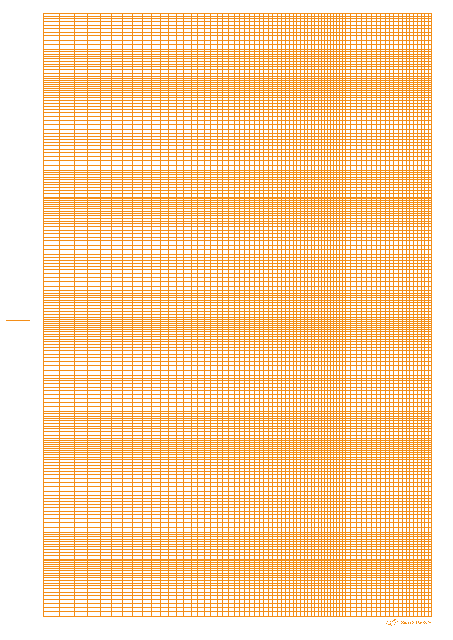
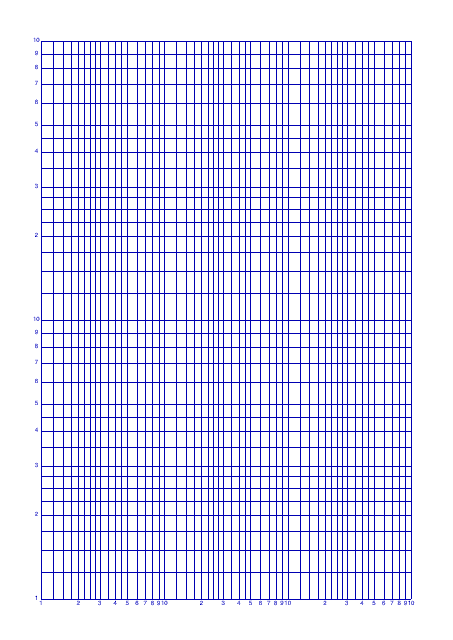
This document provides a logarithmic graph paper template with orange lines, covering 5 decades.