Log Log Paper Templates
Are you in need of printable log log paper templates? Look no further! Our collection of log log paper templates is perfect for your logarithmic plotting needs. Whether you need a template with logarithmic horizontal and vertical axes, or one with different number of decades, we have it all.
Our log log paper templates come in various sizes, including letter-sized paper. You can choose from different options, such as five decades or four decades on both axes, or even two decades. We also offer templates with logarithmic horizontal axis for one decade and logarithmic vertical axis for four decades.
With our log log paper templates, plotting logarithmic functions becomes a breeze. Whether you are working on mathematical equations, data analysis, or scientific research, our templates will make your work more efficient. You can easily plot data points and draw accurate graphs using our printable log log paper templates.
So, why wait? Get started with your logarithmic plotting today by downloading our log log paper templates. They are user-friendly, easy to print, and will save you valuable time and effort. Don't miss out on this essential tool for your mathematical and scientific endeavors. Download our log log paper templates now!
Documents:
18
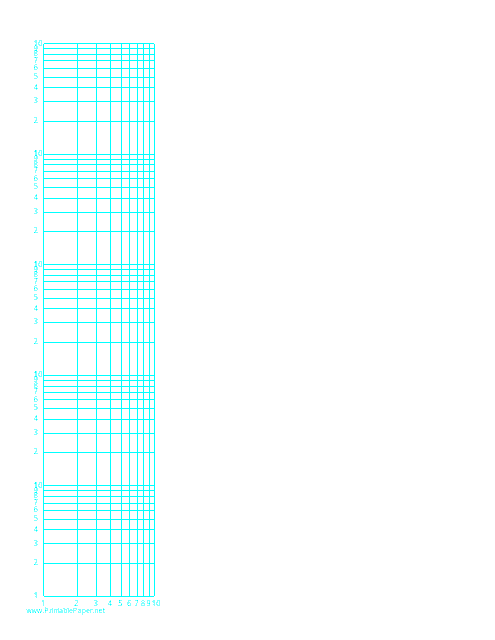
This document provides a printable version of logarithmic graph paper with both horizontal and vertical axes spanning five decades. Ideal for mathematical and scientific calculations where the scale of data spans several orders of magnitude. It is designed to fit on a standard letter-sized paper.
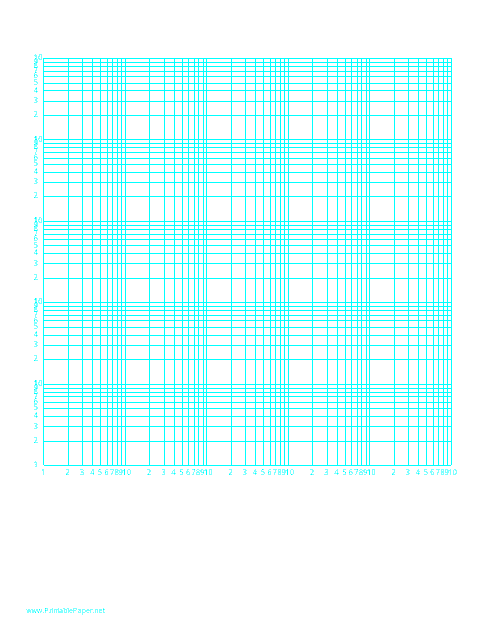
This document provides a printable template for a log-log graph paper. It features logarithmic scales on both horizontal and vertical axes, spanning five decades each, fitting on a standard letter-sized paper. Ideal for advanced mathematical and scientific plotting.
This document provides a grid paper template for a logarithmic scale plot. It features both horizontal and vertical axes, each divided into four decades, on a standard letter-sized paper. It is often used in fields such as engineering or mathematics for presenting data with wide ranges.
This type of document serves as a graphing tool with both horizontal and vertical axes in logarithmic scale. It is typically used in various scientific and engineering fields for representing data that cover a large range.
This document is a printable template for log-log graph paper designed on a letter-sized layout. It features both a logarithmic horizontal and vertical axis, each spanning three decades, and is useful for a variety of scientific and engineering calculations.
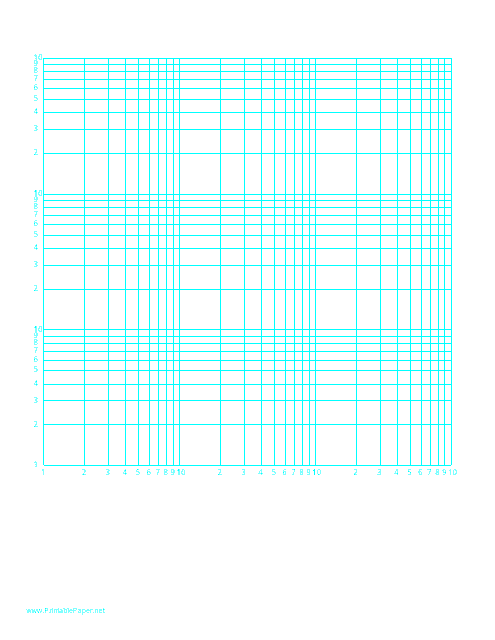
This document provides a grid for plotting exponential data as per logarithmic scale. It's designed with logarithmic horizontal and vertical axes each spanning three decades. It's beneficial for visualising multiplicative changes or variations.
This type of document provides a printable format of a log-log graphing paper featuring a logarithmic horizontal axis (two decades) and logarithmic vertical axis (two decades). Ideal for plotting data with wide ranges of values in a compact way.
This type of document is a specific type of graphing paper that enables data presentation on a scale that displays multiple orders of magnitude. It is utilized in various fields, including engineering and mathematics. The horizontal and vertical axis each represents two decades in a logarithmic scale.
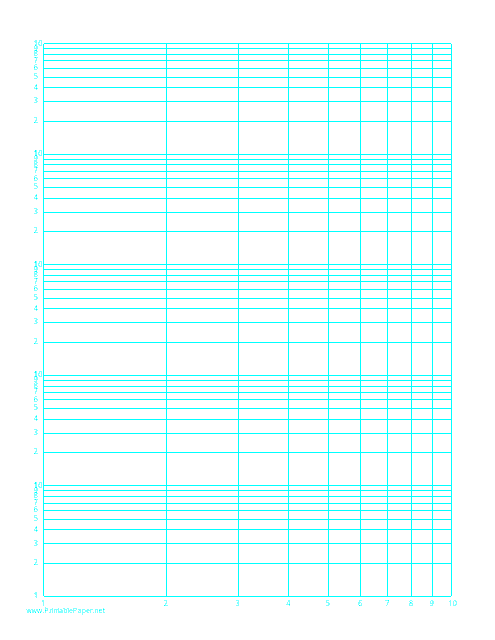
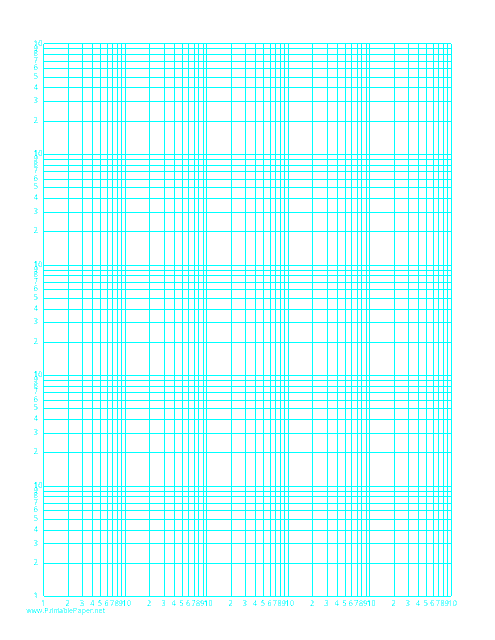
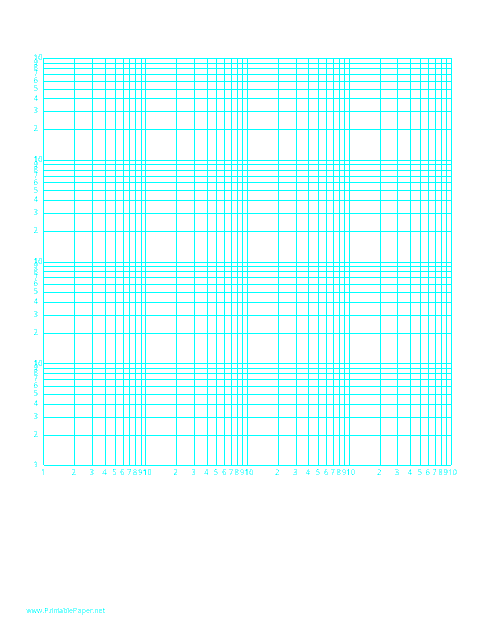
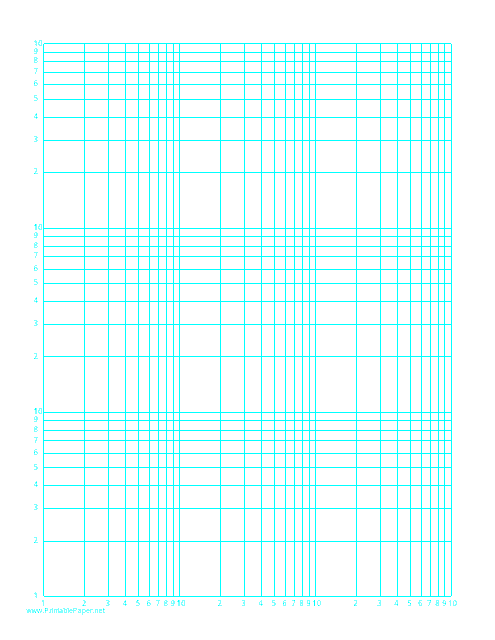
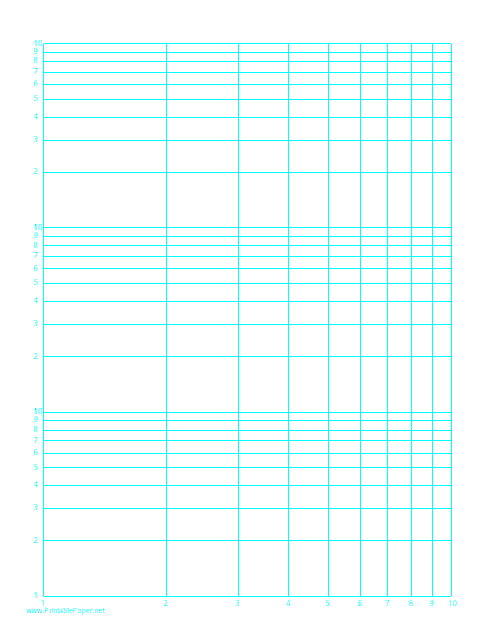
This type of document is designed for mathematical and scientific calculations. It comes with a logarithmic scale on both the horizontal axis (one decade) and vertical axis (five decades) on a standard letter-sized paper. Ideal for representing wide-ranging quantities.
This type of document is utilized for drawing graphs with a wide-ranging scale. It's a special type of paper which allows plotting of functions on both horizontal and vertical axes, displaying one decade on the horizontal axis and five decades on the vertical axis. Suitable for scientific and engineering presentations.
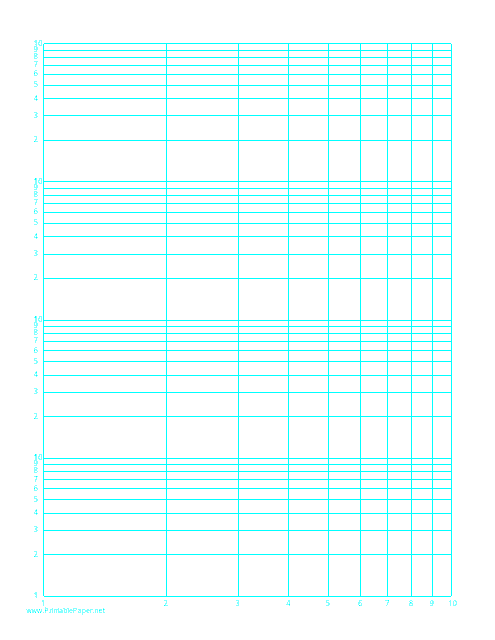
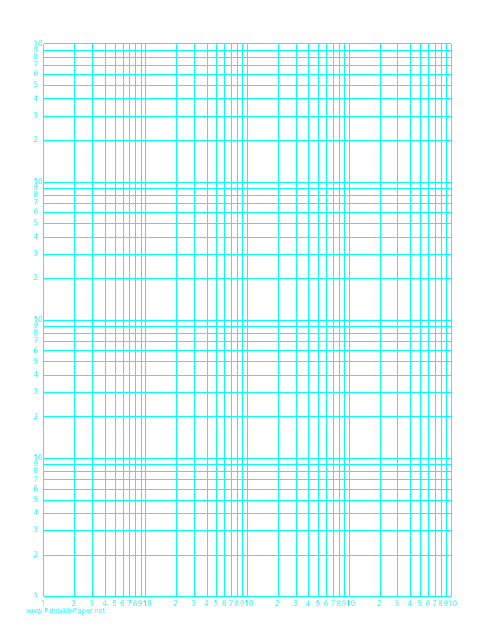
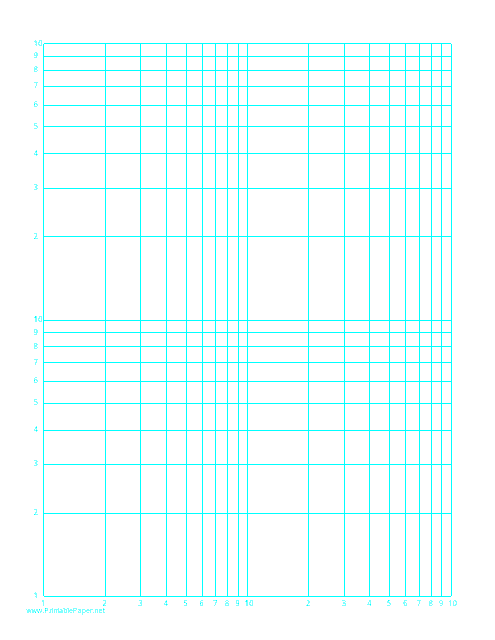
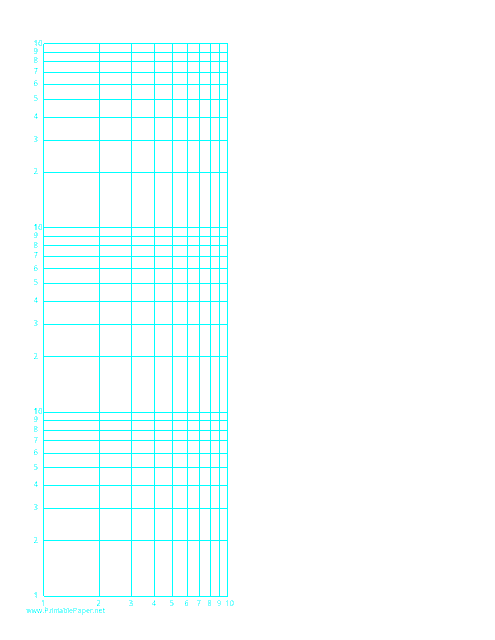
This template is typically used for creating and printing log-log graph paper with specified scaling of logarithmic horizontal axis (one decade) and logarithmic vertical axis (four decades) on the standard letter-size paper. The customizable feature of the template can be used in various applications such as in scientific research, engineering, and mathematical calculations.
This type of document is a printable template for graphing purposes. It features a logarithmic scale on both horizontal and vertical axes, the former covering one decade and the latter encompassing four decades, to plot exponential and rapid-growth data. It's often used in scientific and engineering disciplines.
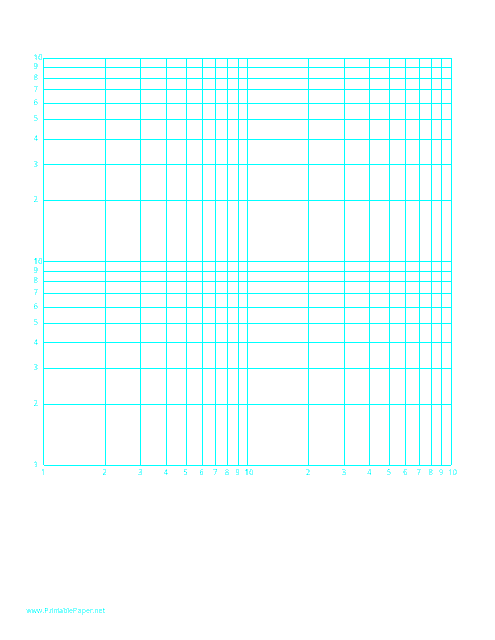
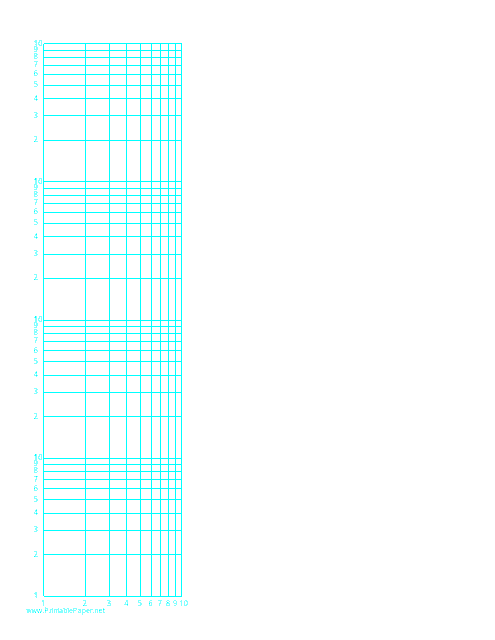
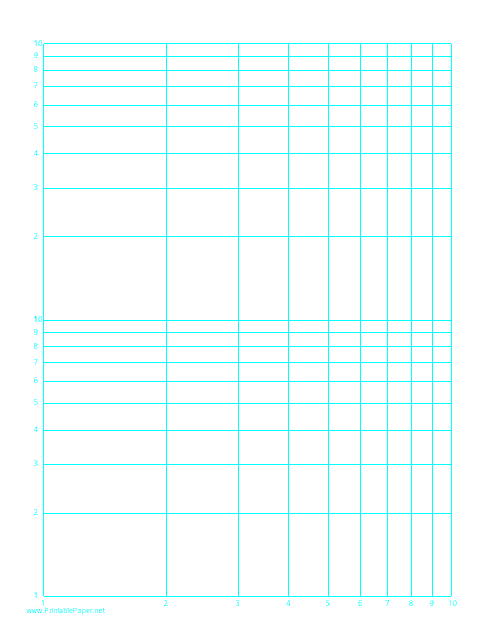
This document is used for plotting data on a logarithmic scale. It is essential for fields like engineering and physics where one needs to illustrate data that changes exponentially or follows a power law. It comprises a horizontal axis spanning one decade and a vertical axis spanning three decades.
This document is a customizable template for log-log graph paper. It features a logarithmic scale on both the horizontal axis that spans one decade and the vertical axis spanning three decades. Ideal for plotting data with wide-ranging values in scientific and engineering disciplines.
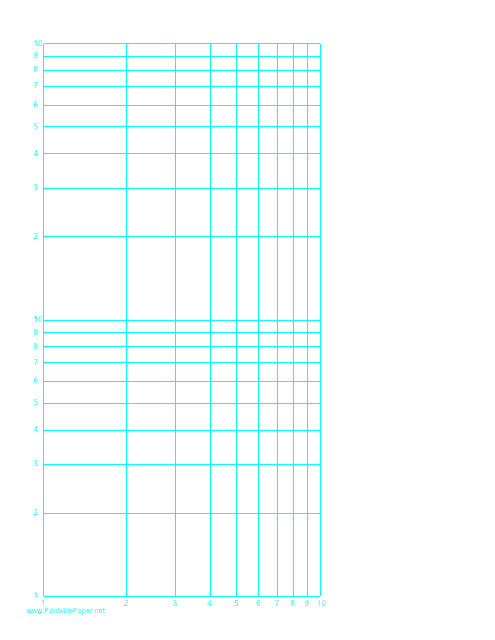
This document is a cyan log-log paper template with a logarithmic horizontal axis spanning one decade and a logarithmic vertical axis spanning two decades. It is used for plotting data with logarithmic scales.
This template is designed for creating graph paper with logarithmic scales on both the horizontal and vertical axes. It is suitable for plotting functions with exponential growth or decay, auditory and seismic data, or any other measurements that cover a large range of values on a letter-sized paper.
This template is designed for plotting complex data on a logarithmic scale for both horizontal and vertical axes. Providing predefined scales, it's perfect for technical and scientific uses, especially when dealing with extensive data ranges or exponential growth or decline.
This template is used for plotting data on a logarithmic scale for both the horizontal and vertical axis. The scales are equal and cover one decade, allowing for more precise visualization and comparison of exponential or rapidly-changing data.
