Logarithmic Scale Templates
Logarithmic Scale
Looking for a way to express data that spans a wide range of values? Look no further than logarithmic scale, also known as log scale or semi-log scale. This unique measurement system is designed to handle data that covers multiple orders of magnitude, making it ideal for scientific and technical applications.
Logarithmic scale allows for the visualization and analysis of data that varies exponentially. It compresses data at the higher end of the scale, allowing fine details to be observed in regions that would otherwise be dominated by larger values. This makes it particularly useful in fields such as engineering, finance, and environmental studies where data can span several orders of magnitude.
Our logarithmic scale documents collection offers a variety of tools and resources to help you effectively work with logarithmic scales. Whether you're looking for log-log paper with logarithmic horizontal and vertical axes, or specialized log graph paper designed for specific applications, we've got you covered.
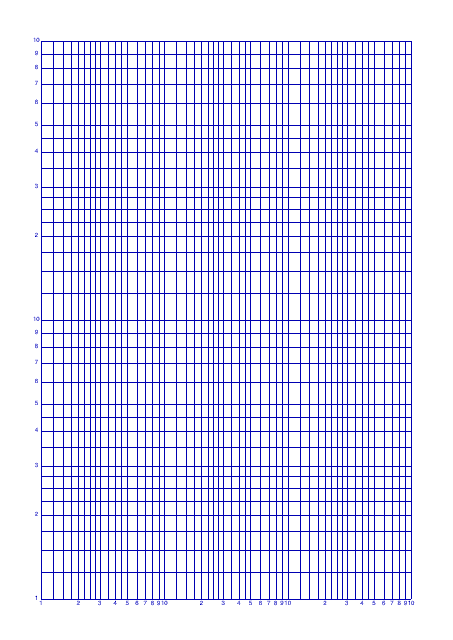
One example is our "Log-Log Paper With Logarithmic Horizontal Axis (Three Decades) and Logarithmic Vertical Axis (Three Decades) on Letter-Sized Paper". This handy tool provides a convenient layout for plotting data on logarithmic scales, making it easy to analyze relationships between variables that exhibit exponential growth or decay.
Another option is our "Log Graph Paper - 3 Cycle Log". This specialized paper features a logarithmic scale that allows you to plot data with three cycles per decade, offering a balanced representation of values spanning a wide range.
If you prefer a touch of color, our "Log Graph Paper - Blue" adds a vibrant twist to your logarithmic plots. With its distinctive blue logarithmic grid, this paper combines functionality with aesthetics.
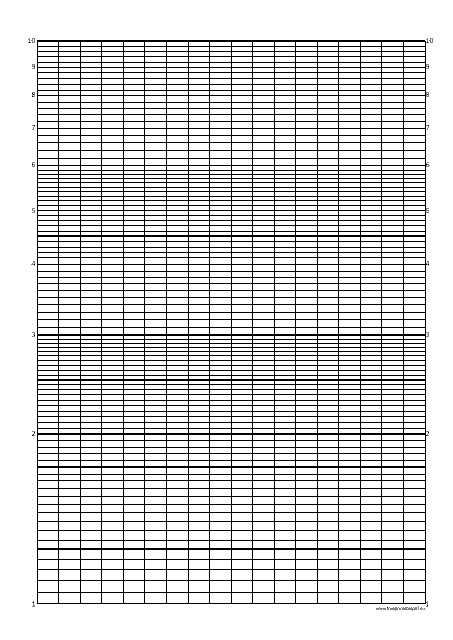
For those working on more specialized projects, our "Logarithmic Graph Paper - 10*1" provides a unique format that allows you to plot data with a logarithmic scale of 10 divisions per decade on the horizontal axis and a linear scale on the vertical axis. This flexibility makes it a valuable tool for various scientific and mathematical applications.
In addition to these examples, our collection includes a range of other logarithmic scale resources, such as semi-logarithmic paper and logarithmic scale templates for digital plotting. Whatever your logarithmic scale needs may be, our documents collection is sure to have the right tools to help you effectively visualize and analyze your data.
Experience the power of logarithmic scale and unlock new insights in your data analysis. Explore our logarithmic scale documents collection today and take your understanding of exponential relationships to new heights.
Documents:
16
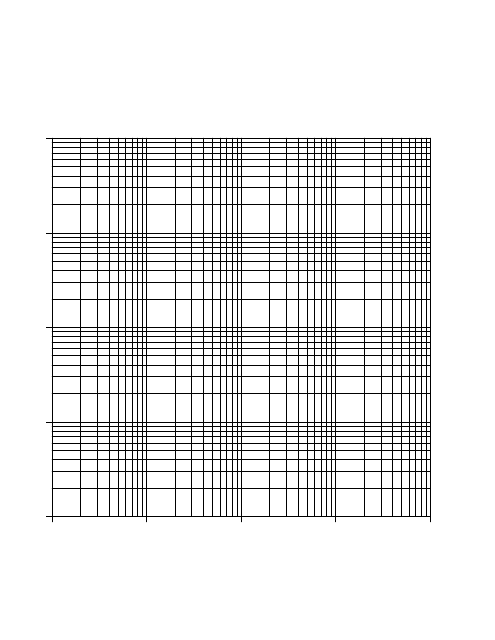
This type of document serves as a graphing tool with both horizontal and vertical axes in logarithmic scale. It is typically used in various scientific and engineering fields for representing data that cover a large range.
This document is a printable template for log-log graph paper designed on a letter-sized layout. It features both a logarithmic horizontal and vertical axis, each spanning three decades, and is useful for a variety of scientific and engineering calculations.
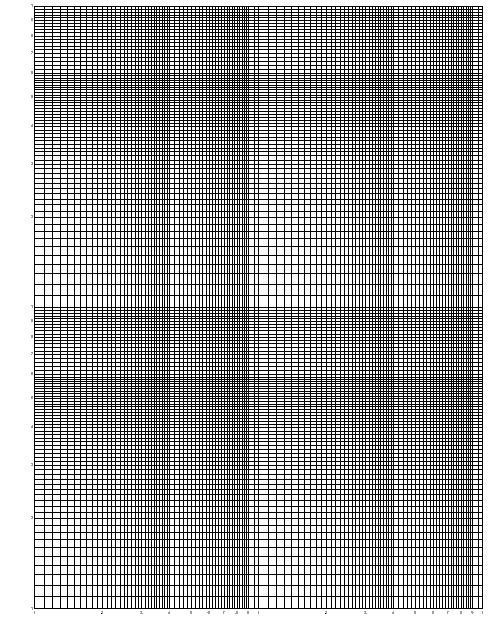
This document provides a grid for plotting exponential data as per logarithmic scale. It's designed with logarithmic horizontal and vertical axes each spanning three decades. It's beneficial for visualising multiplicative changes or variations.
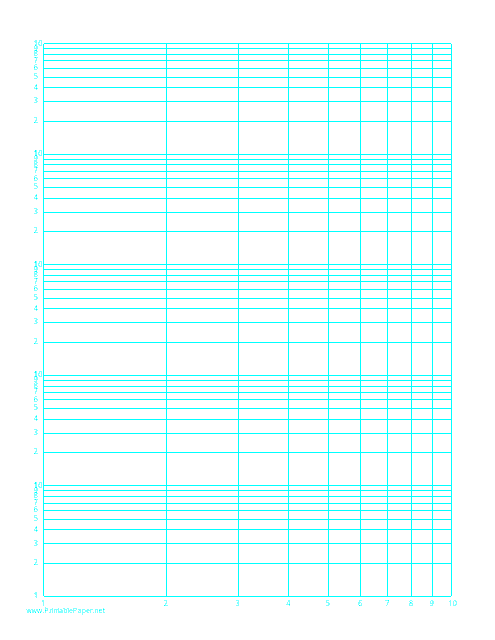
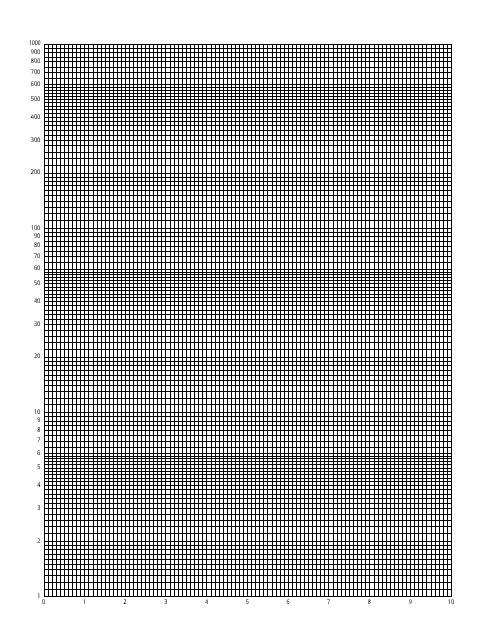
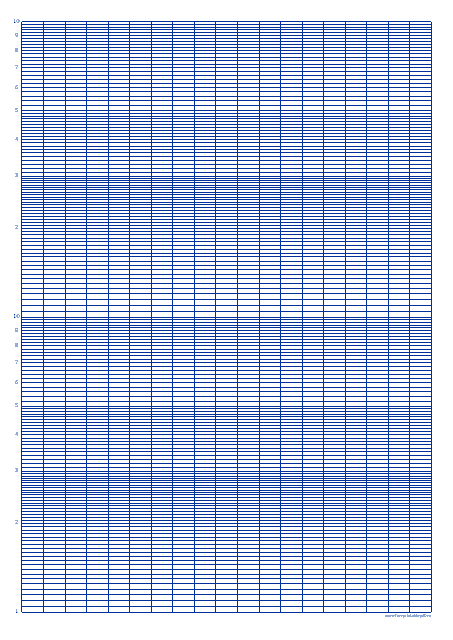
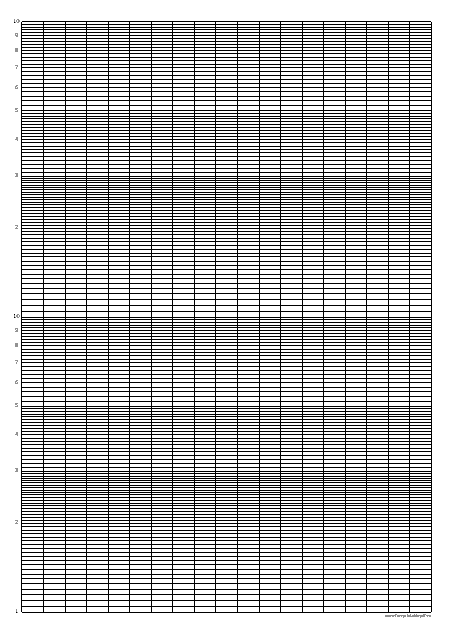
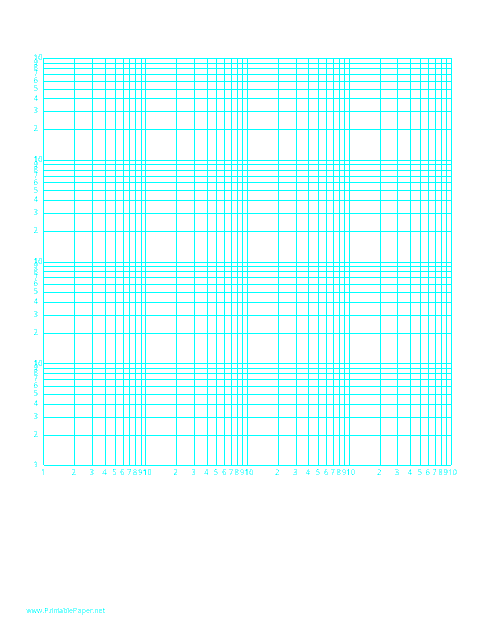
This type of document is designed for mathematical and scientific calculations. It comes with a logarithmic scale on both the horizontal axis (one decade) and vertical axis (five decades) on a standard letter-sized paper. Ideal for representing wide-ranging quantities.
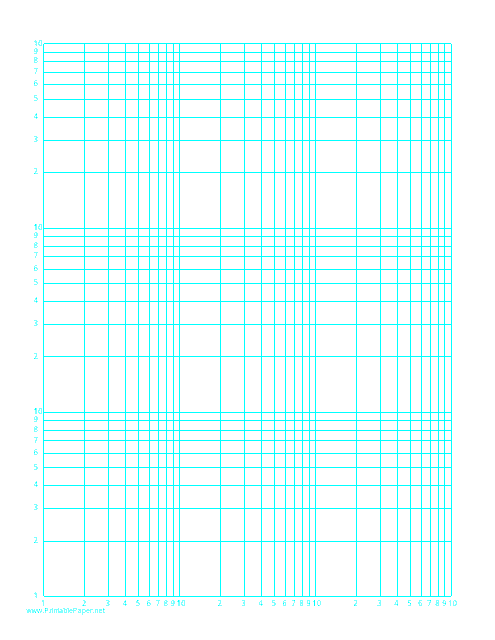
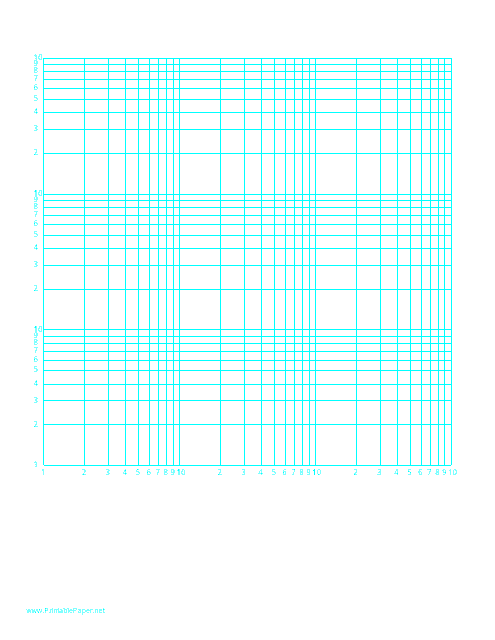
This type of document is a printable template for graphing purposes. It features a logarithmic scale on both horizontal and vertical axes, the former covering one decade and the latter encompassing four decades, to plot exponential and rapid-growth data. It's often used in scientific and engineering disciplines.
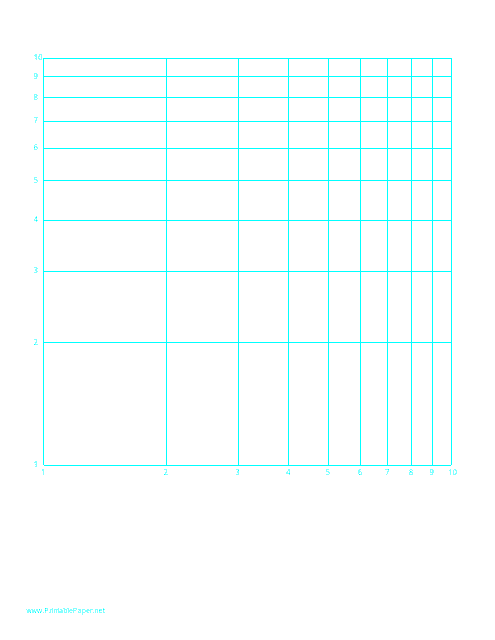
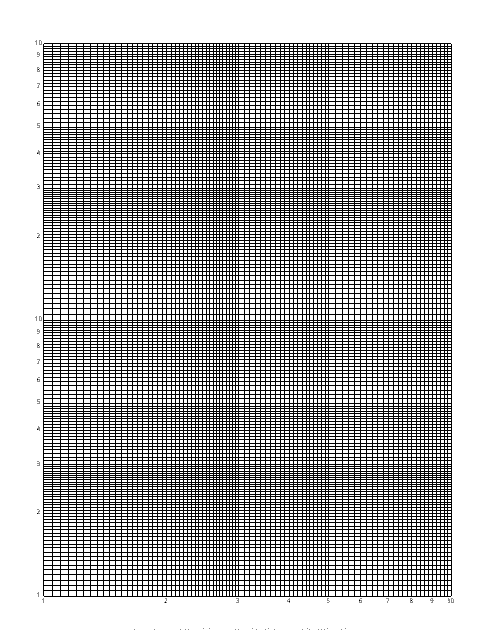
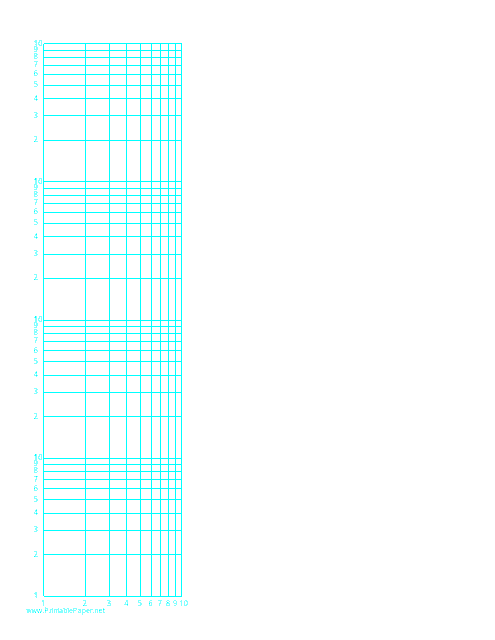
This template is used for plotting data on a logarithmic scale for both the horizontal and vertical axis. The scales are equal and cover one decade, allowing for more precise visualization and comparison of exponential or rapidly-changing data.
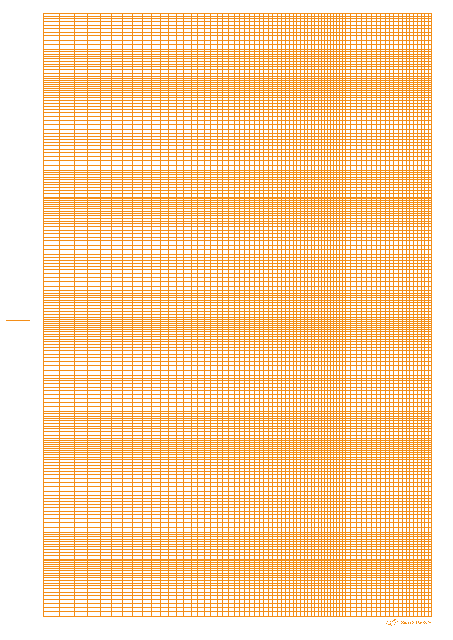
This document provides a logarithmic graph paper template with orange lines, covering 5 decades.
This document provides a quick reference guide for understanding and solving problems related to exponents and logarithms. It includes formulas, examples, and helpful tips.