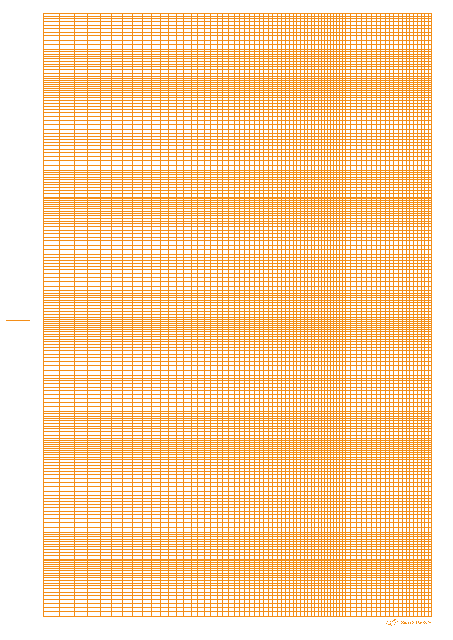
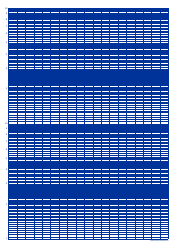
Orange Logarithmic Graph Paper Template - 5 Decades
The Orange Logarithmic Graph Paper Template - 5 Decades is typically used for plotting data that spans a wide range of values, such as exponential growth or decay functions. The logarithmic scale allows for easy visualization of data that covers a large magnitude of numbers.
FAQ
Q: What is an orange logarithmic graph paper template?
A: An orange logarithmic graph paper template is a specialized type of graph paper that is used to plot data on a logarithmic scale.
Q: What is a logarithmic scale?
A: A logarithmic scale is a scale where the values increase exponentially rather than linearly.
Q: What are the main features of the orange logarithmic graph paper template?
A: The main features of the orange logarithmic graph paper template include five decades (or five cycles) of logarithmic intervals.
Q: What is a decade?
A: A decade is a range of ten numbers or values.
Q: What are logarithmic intervals?
A: Logarithmic intervals are the divisions on the graph paper that represent different orders of magnitude.
Q: How is the orange logarithmic graph paper template used?
A: The orange logarithmic graph paper template is used to graph data that spans a wide range of values, where a logarithmic scale is preferred over a linear scale.
Q: What is the advantage of using logarithmic graph paper?
A: Using logarithmic graph paper allows for a more accurate representation of data that spans multiple orders of magnitude.
