Logarithmic Graph Templates
Are you looking for a convenient and efficient way to plot and analyze data that displays exponential growth or decay? Look no further than our collection of logarithmic graph templates. Also known as logarithmic graphing or logarithmic graph paper, these resources are designed to help you visually represent data that spans a wide range of values.
Our logarithmic graph templates provide you with the tools you need to create accurate and precise graphs. Whether you're studying population growth, bacterial growth, or any other phenomena that follow an exponential pattern, our logarithmic graph templates are here to make your analysis a breeze.
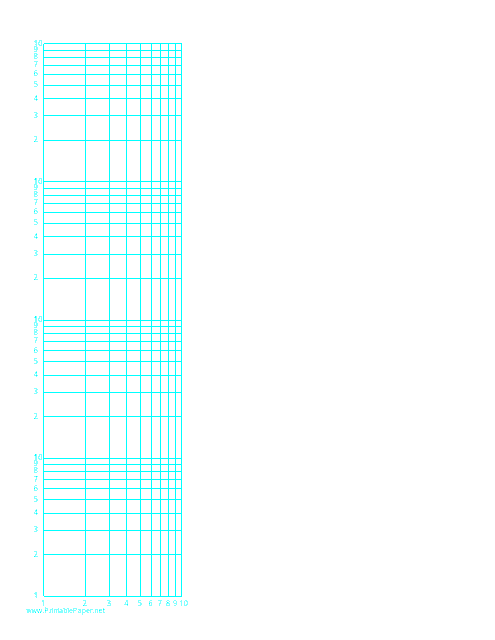
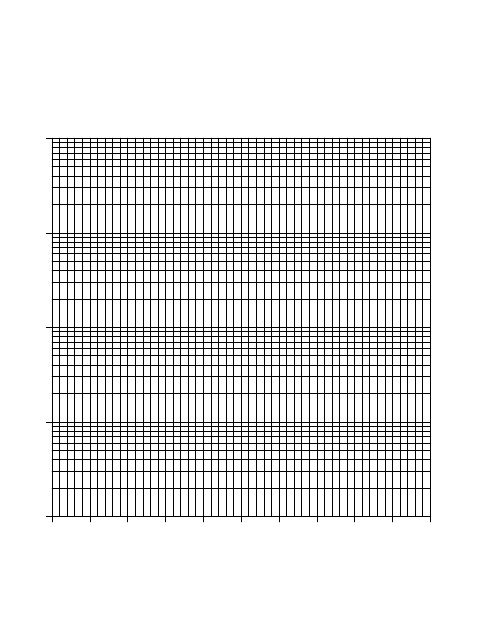
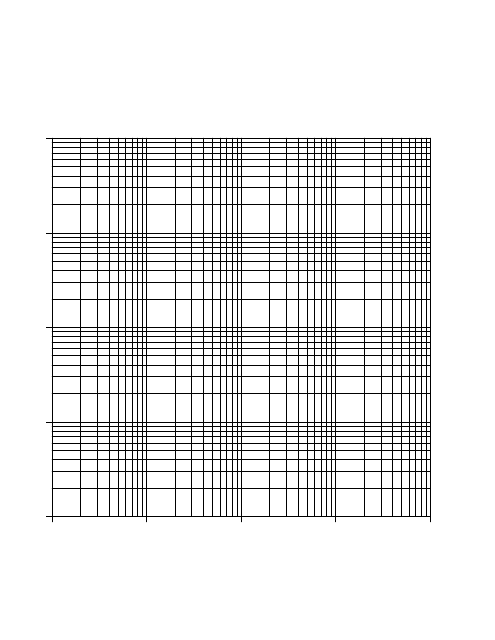
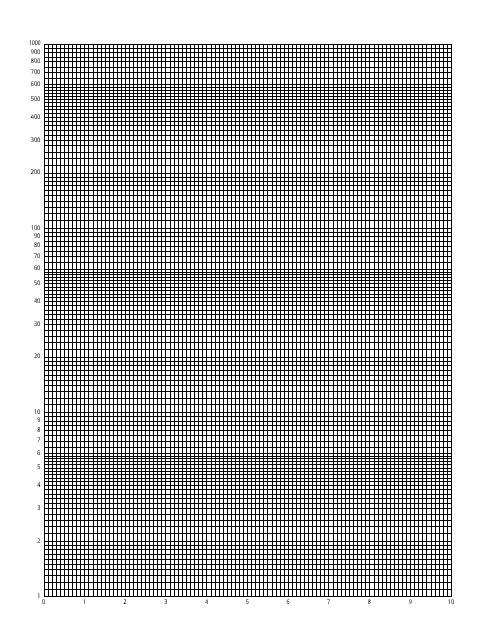
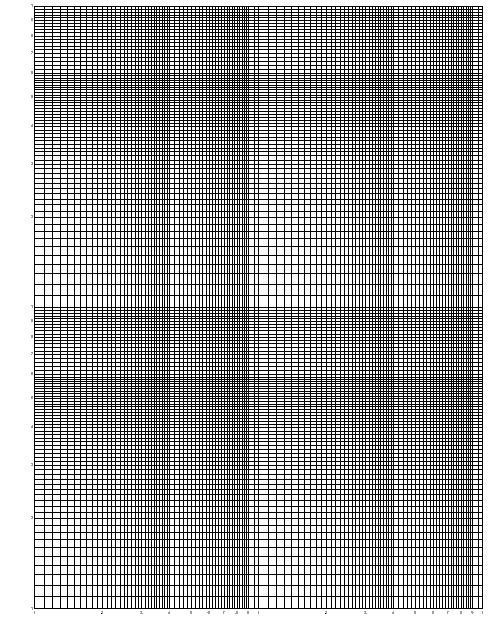
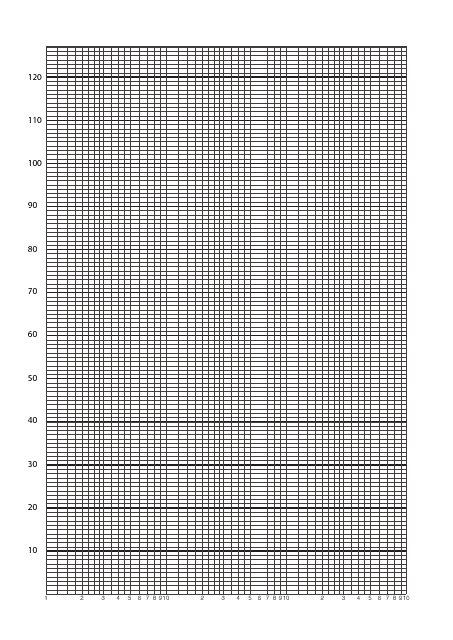
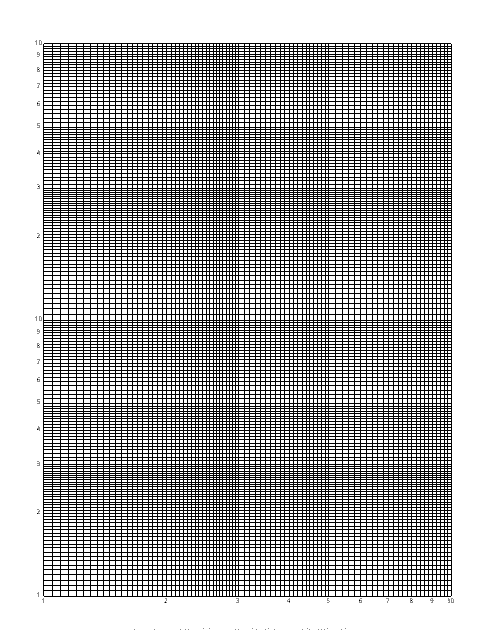
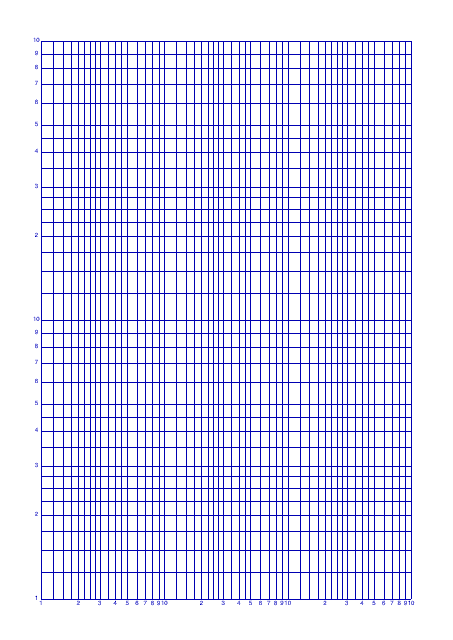
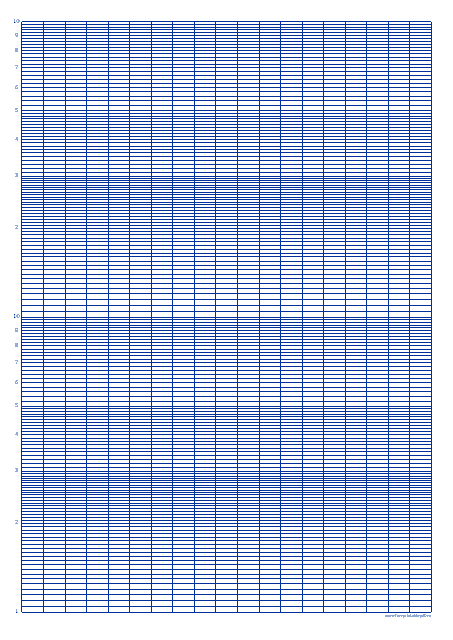
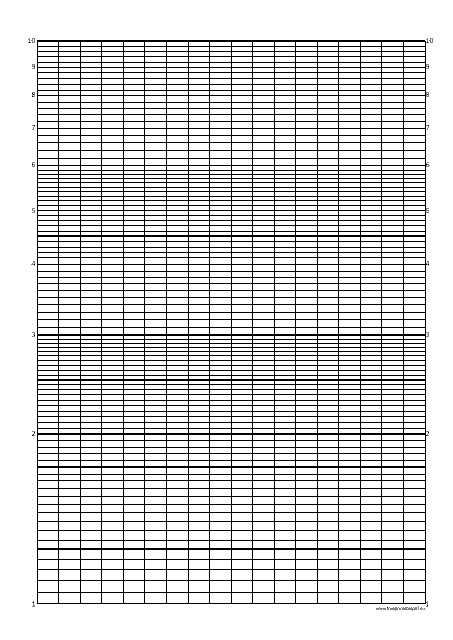
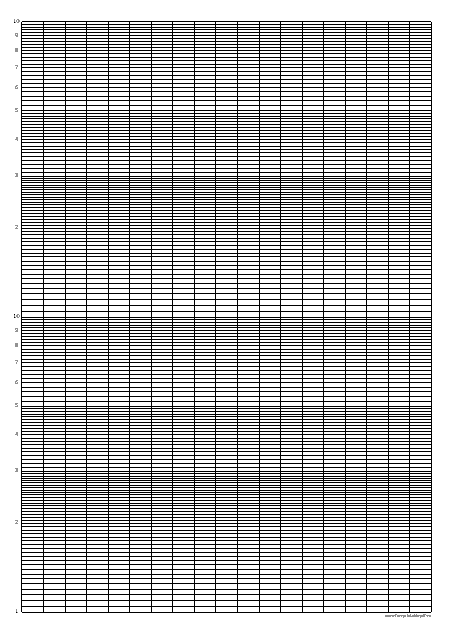
With our 3 Cycle Semi-log Graph Paper, you can easily plot data that exhibits exponential growth or decay. The Logarithmic Graph Paper Template offers a customizable solution, allowing you to tailor your graph to suit your specific needs. For those looking to plot data on a linear scale while still incorporating logarithmic elements, our Log-Linear Graph Paper is the perfect choice. And if you prefer a splash of color, our Logarithmic Graph Paper - Blue adds a touch of vibrancy to your data representation.
Also known as semi-logarithmic paper, our logarithmic graph templates are a versatile tool for scientists, engineers, mathematicians, and anyone working with data that requires precise representation on a logarithmic scale. By providing a logarithmic grid, these templates allow you to easily visualize the relationship between variables and uncover patterns that may not be apparent on linear scales.
So, whether you're conducting scientific research, analyzing market trends, or studying natural phenomena, our collection of logarithmic graph templates is your go-to resource for effective data visualization. Choose from our wide range of templates and unlock the power of logarithmic graphs in your research and analysis. Start graphing with ease and accuracy today with our logarithmic graph templates!
Documents:
11
This type of document is a printable template for graphing purposes. It features a logarithmic scale on both horizontal and vertical axes, the former covering one decade and the latter encompassing four decades, to plot exponential and rapid-growth data. It's often used in scientific and engineering disciplines.

