Data Representation Templates
Looking for a comprehensive resource on data representation? You've come to the right place! Our collection of documents on data representation covers various techniques and tools used to visually communicate information.
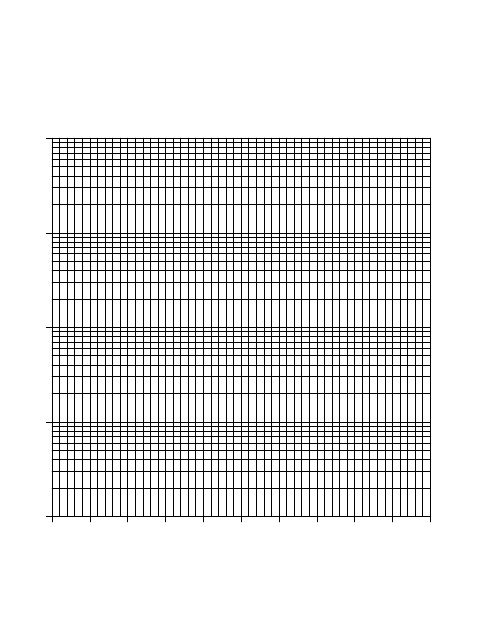
Whether you're a student studying math or looking for professional applications, our data representation documents have you covered. Explore our Binary Information Cheat Sheet, which provides a handy reference for understanding the binary number system. Dive into our 3 Cycle Semi-log Graph Paper, ideal for plotting and analyzing data using a logarithmic scale. If you're preparing for a math exam, our Math Exam Questions: Scatter Graphs - Corbettmaths document will help you practice interpreting and creating scatter graphs effectively.
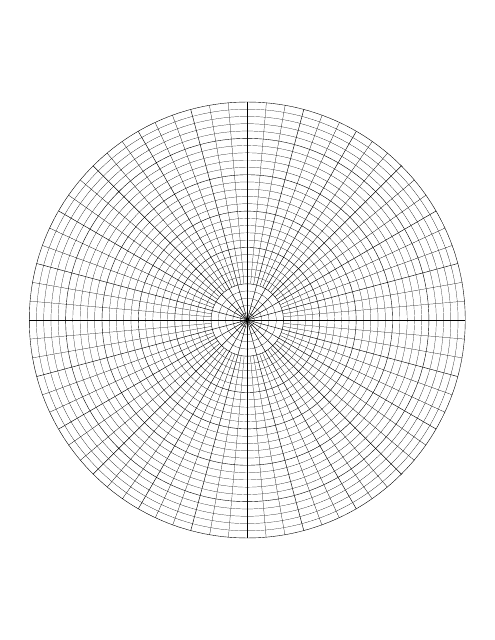
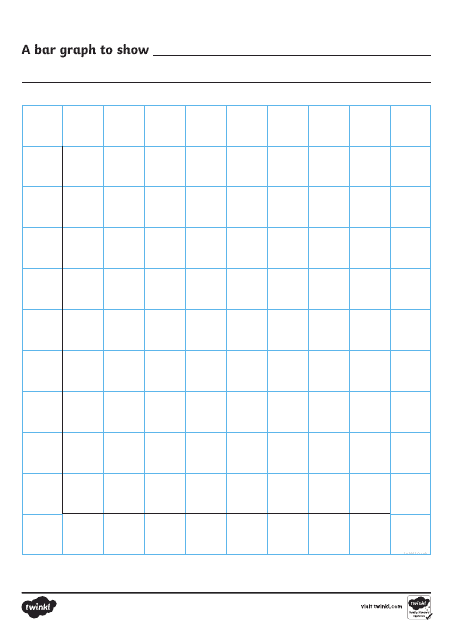
In addition to these examples, our data representation collection includes resources such as Circular Graph Paper, perfect for creating visually appealing pie charts and circular diagrams, as well as Bar Graph Templates that facilitate the creation of informative bar graphs.
Whether you're a student, educator, or professional, our data representation documents offer a diverse range of information and tools to enhance your understanding and presentation of data. Explore our collection now and start representing data with precision and clarity.
Documents:
7
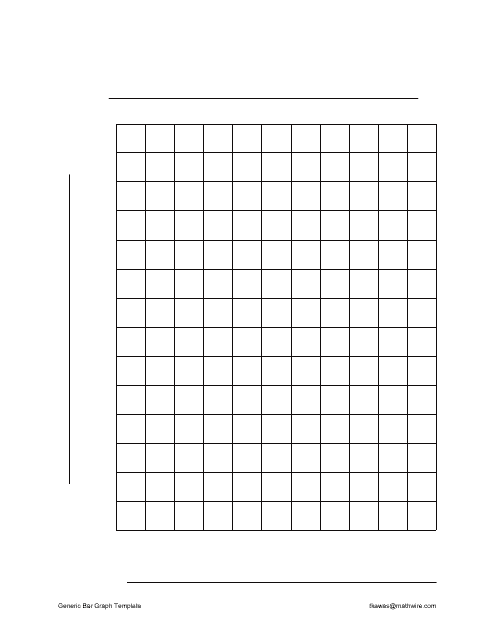
This template is used to create bar graphs for various purposes. It provides a basic layout for organizing data and visualizing trends using bars of different lengths. Customizable and easy to use.
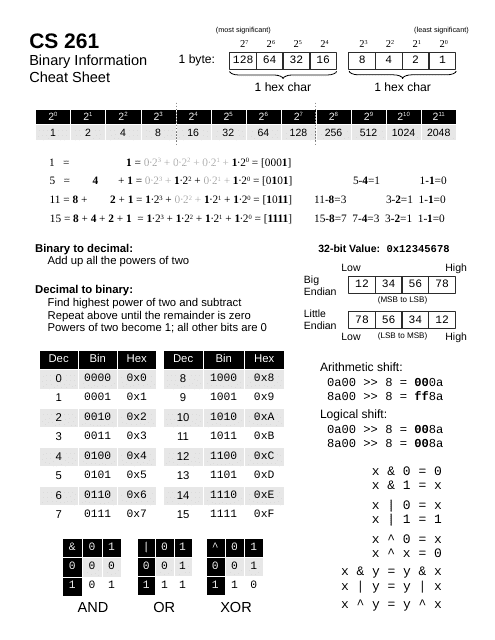
This document provides a handy reference guide for understanding binary information and its representation. It covers topics such as binary numbers, binary operations, and data conversion techniques. A useful resource for anyone looking to learn or revise binary concepts.