Free Polar Graph Paper Templates
Polar Graph Paper: What Is It?
Polar Graph Paper refers to a medium that contains a visual instrument used to compare several variables with the help of a coordinate plane.
Alternate Name:
- Polar Coordinate Graph Paper.
Traditionally, it looks like multiple axes connected by a single central point - the axes are supposed to be at the same distance from the core of the chart. It is a perfect tool to use when you have multiple graphs that do not differ from one another a lot which is why this type of paper is a preferred choice for mathematics, engineers, and data analysts - all these individuals can put the data they have gathered on the graph and interpret it to resolve an issue or contribute to a strategic business decision.
For a full list of Polar Graph Paper templates please check out our library below.
How to Use Polar Graph Paper?
Here are some tips you may apply when working with Graph Paper for Polar Coordinates:
- Make sure you identify the elements of the chart properly - there should be a focal point (the core from which all the lines come out), the axes that represent various categorical values you assign to them, and the grids whose purpose is to streamline information better. Leave the background blank and use different colors to present data - write down the clarifications and remarks at the bottom of the Polar Graph Paper.
- Do not overcomplicate the eventual graph - a cluttered diagram will not be visually appealing, and it is much harder to present a point of view on multiple variables especially if you are sharing information with your colleagues, subordinates, and superiors. Pick several specifics to analyze and include not more than five factors in every graph since an abundance of details might make your work unreadable.
- Determine what values should be added to axes . For example, an individual given a task to evaluate the performance of salespeople that work in a particular store can calculate how many sales have been finalized, how many new clients the salesperson has brought to the business, how quickly they were able to resolve routine issues all employees encounter, and how many errors they may have committed over a certain period of time.
- Consider creating a draft of the polar graph to better comprehend how it works before applying it to the multivariate data you are studying or working with . For instance, this paper can be useful when you are comparing statistics of athletes - enter the details of the performance of two, three, or four hockey players, see how many scoring chances they have had, how often they were able to convert those into goals, and how many games their teams ended with a positive result. The graph will show you who the most complete and balanced player is as well as give you an insight into their weak points that can be improved
Still looking for a particular template? Take a look at the related templates below:
Documents:
39
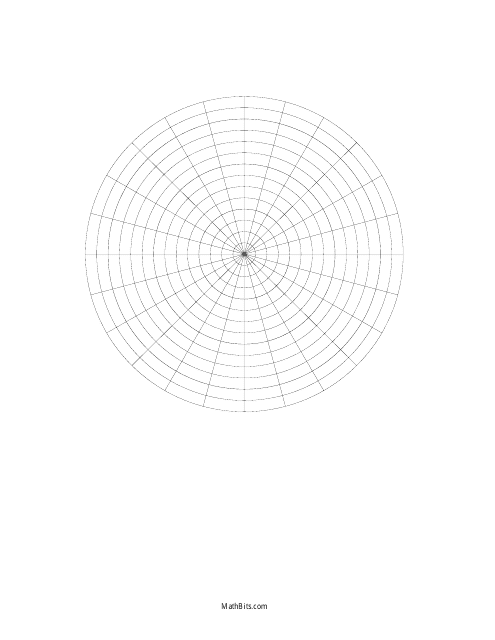
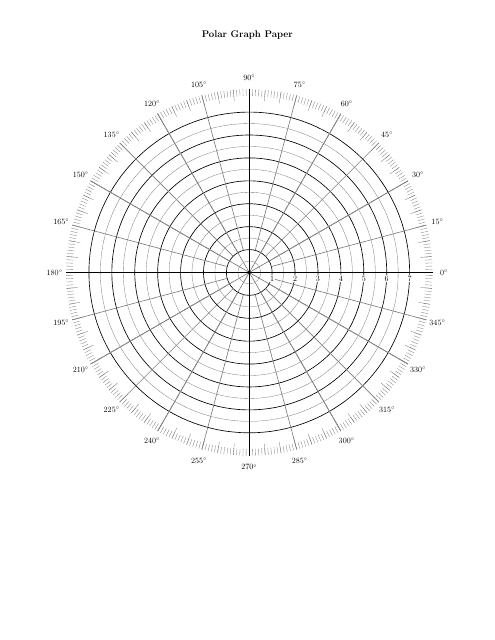
This document is a printable template often used by mathematicians, engineers, and students to plot polar coordinates or functions in the form of a black and white grid.

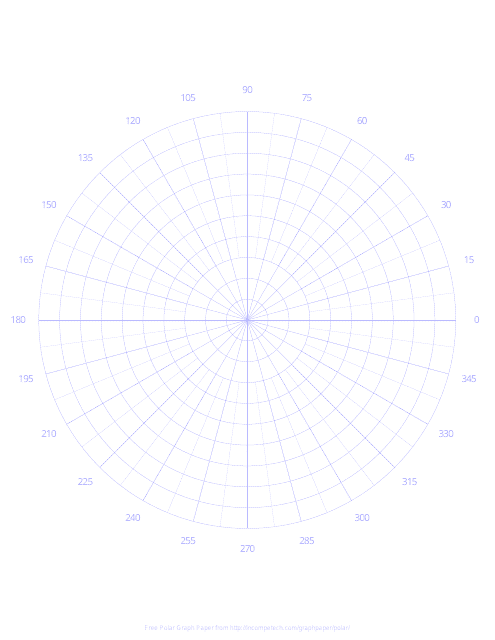
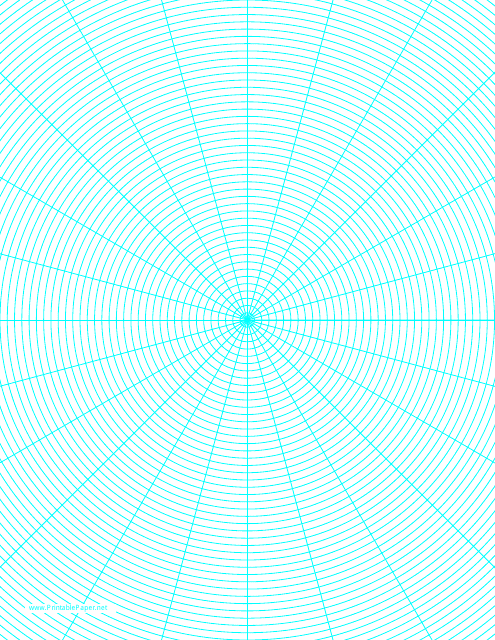
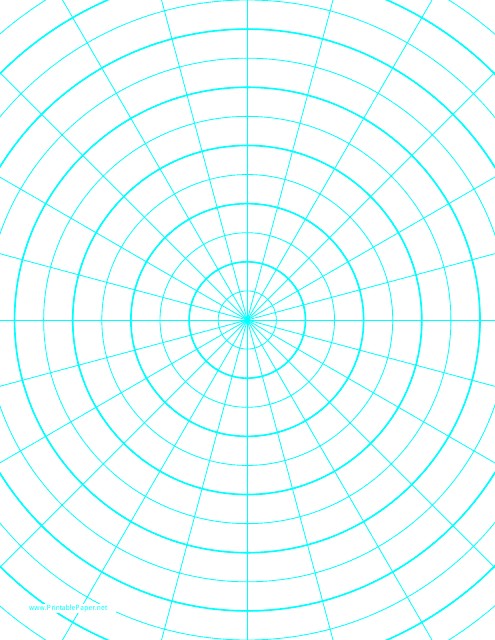
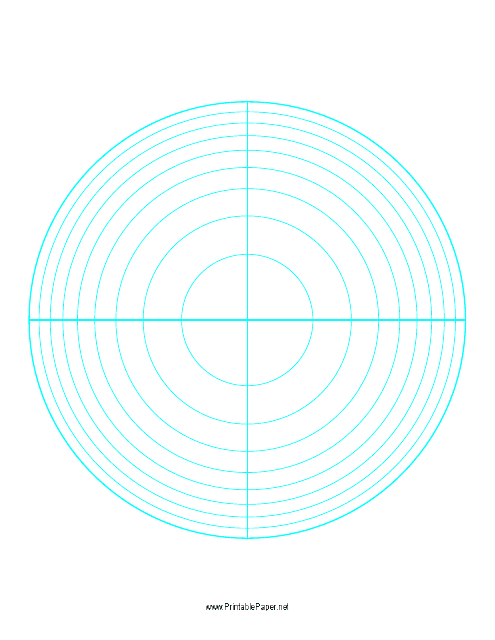
This document is a printable graph paper with concentric circles laid out for plotting polar coordinates. The circular design with incremental degrees, make it easy for mathematicians, engineers and artists to create complex structures, designs or solve mathematical problems. Featured in blue color, it brings an elegant look enhancing its usability.

This document includes printable polar graph paper that is larger than normal size. Ideal for plotting polar coordinates, representing mathematical functions and making detailed diagrams used in fields like physics or engineering.
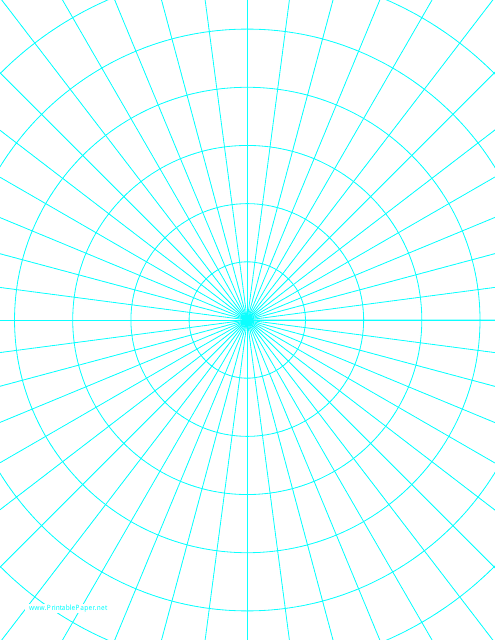
This type of document provides large-sized polar graph paper used for plotting polar coordinates, for the creation of pie charts, or circle graphs, to aid in understanding geometrical and trigonometric concepts in mathematics. Ideal for students, engineers, and mathematicians.
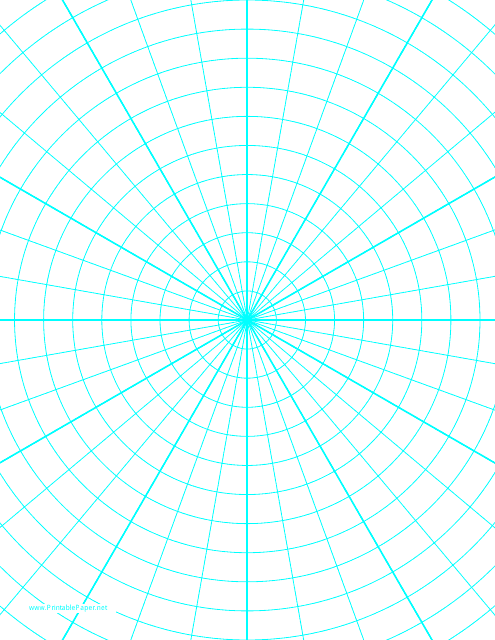
This type of document provides specialized paper used for graphing polar coordinates, commonly applied in mathematics or various engineering fields for plotting circular or radial data.
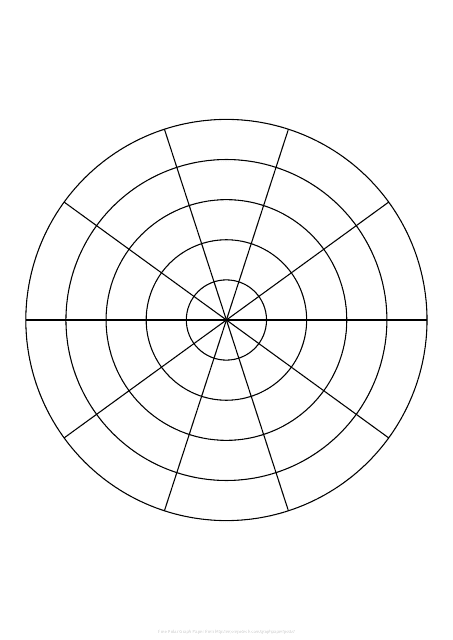
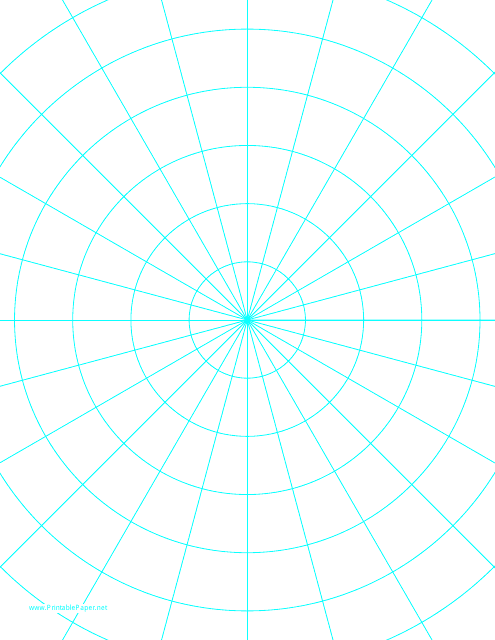
This type of document provides printable ray-style polar graph paper, typically used for creating circular or angle-based mathematical diagrams and plots. It's ideal for students, teachers or anyone needing to create complex patterns related to polar coordinates.
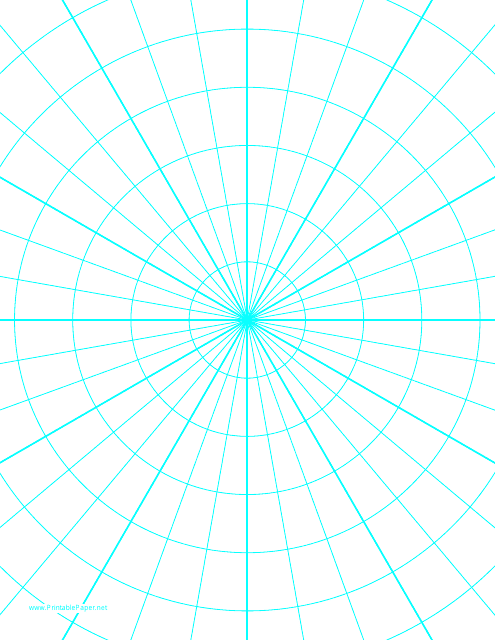
This document is a printable template primarily used by mathematicians, engineers, and students for plotting polar coordinates, which are two-dimensional systems associated with angles and distances.
This type of document is generally utilized in mathematics, specifically for graphing polar coordinates, equations, and curves. It features radial distance and angles on a grid tailored for the task.
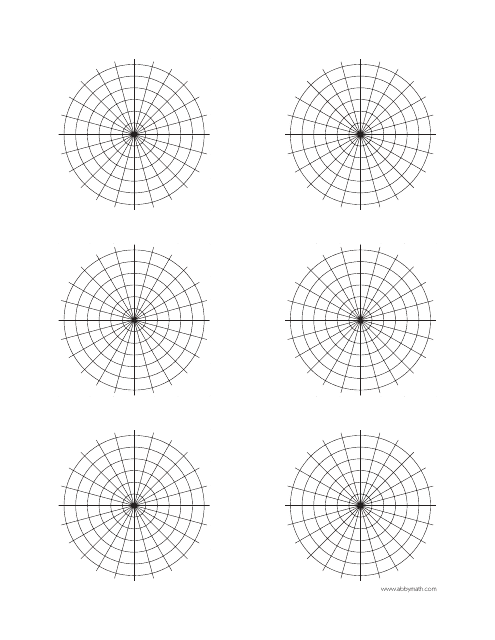
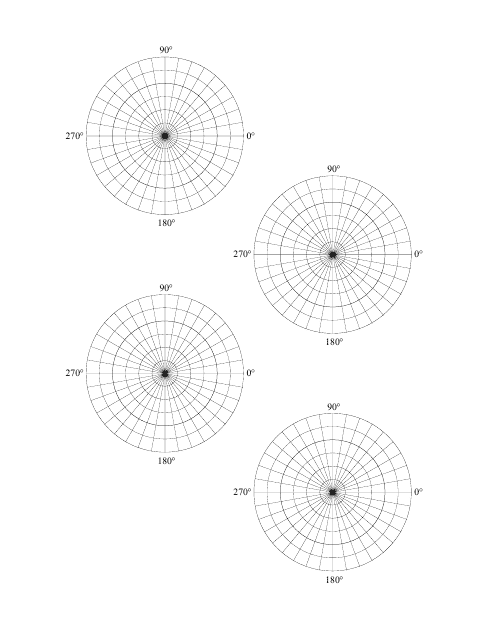
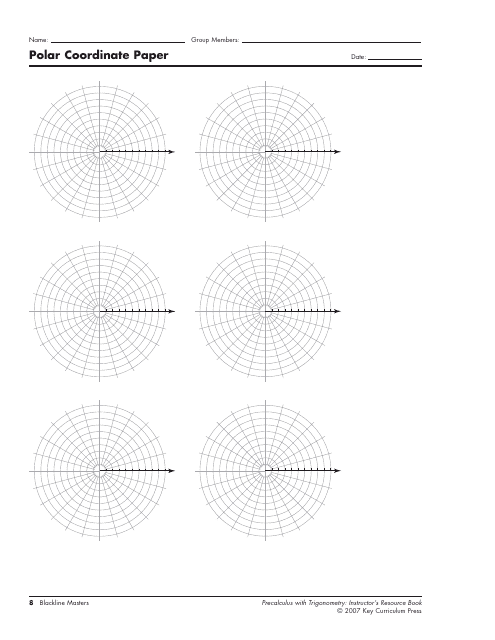
This type of document provides a printable template of little polar graph paper. It's primarily used in mathematics to draw polar coordinates and complex mathematical calculations.
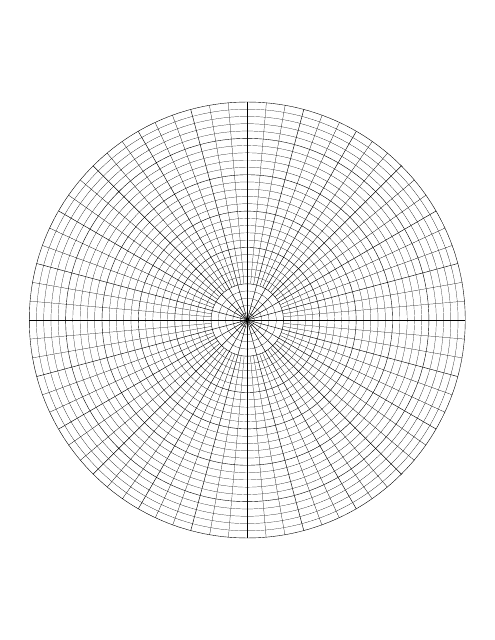
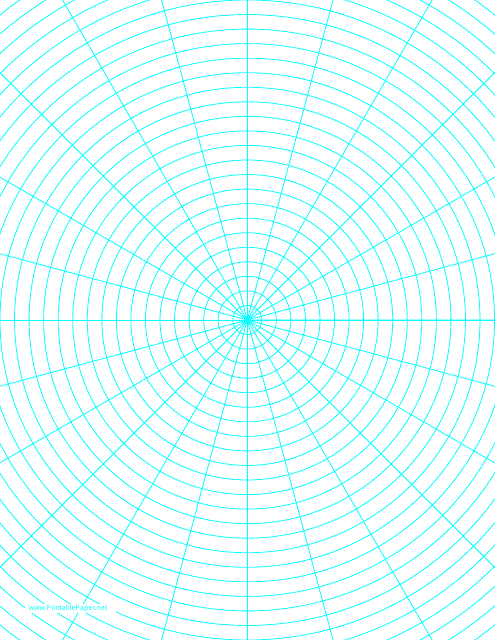
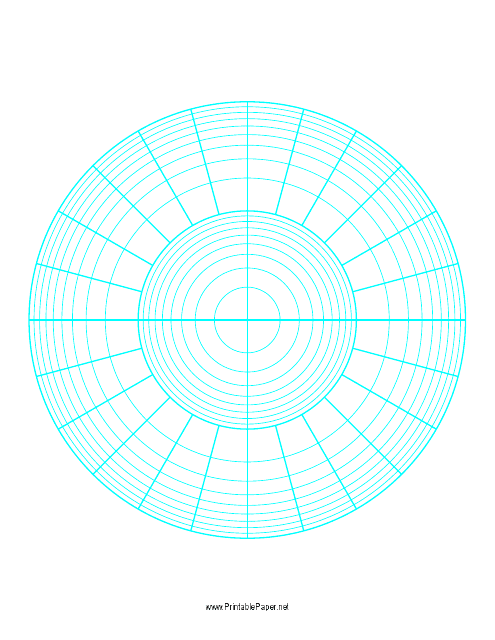
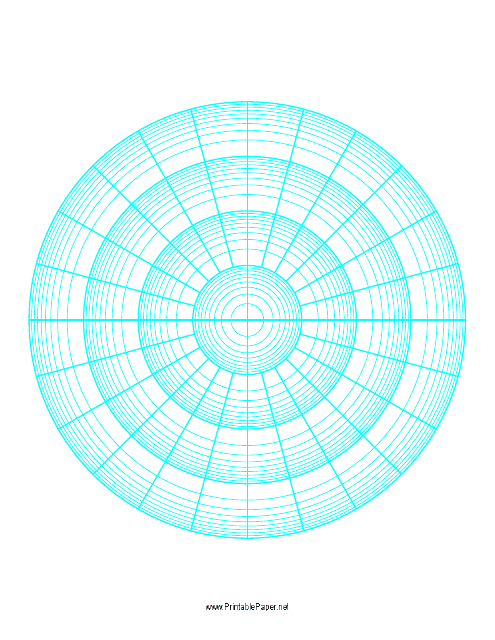
This document typically includes printable or digitally interactive graph paper featuring concentric circles divided into small arcs or 'pie wedges' helpful in plotting polar coordinates, functions, and experimental data in mathematical, engineering, and physical sciences studies.
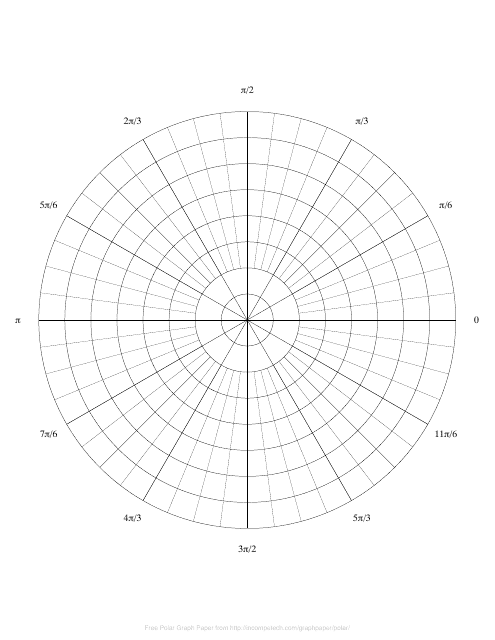
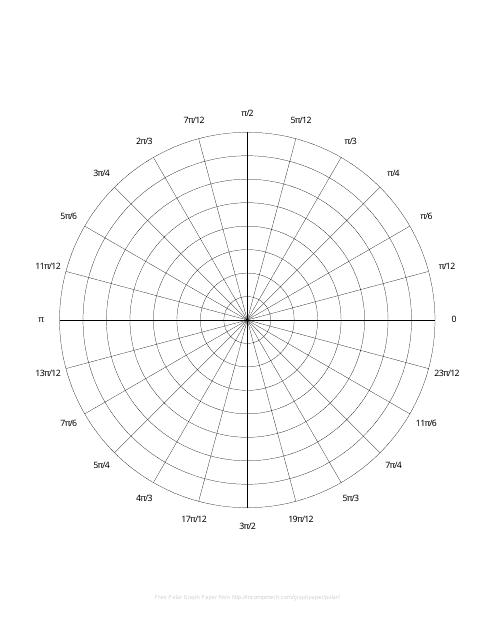
This document provides a template for a polar graph paper, which is used in mathematics, physics, engineering and other related fields for data representation in polar coordinates. It's especially useful for plotting angles in degrees or radians.
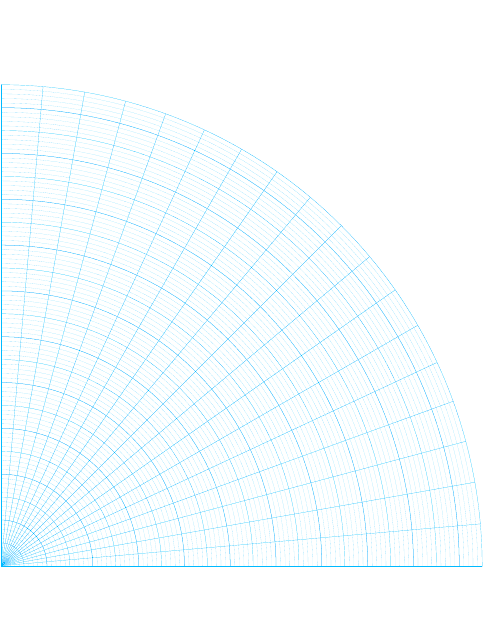
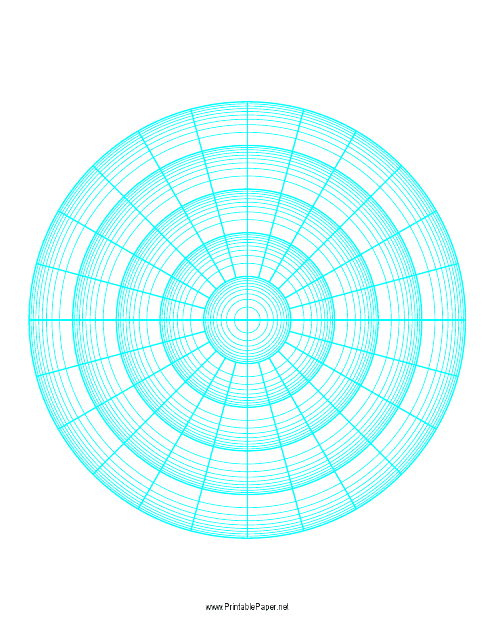
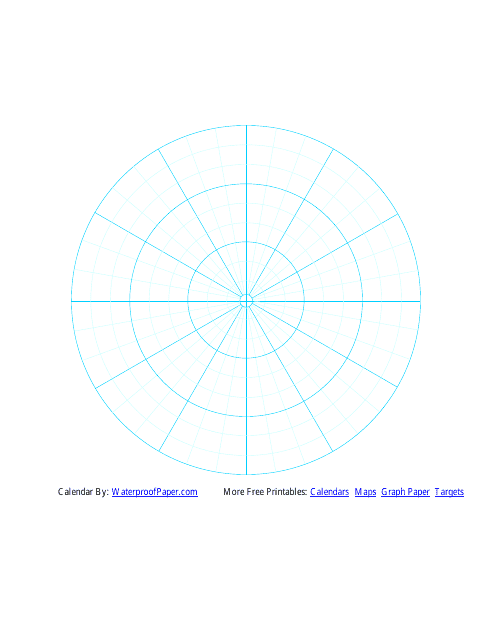
This document is a template for cyan polar graph paper. It is used for plotting points and drawing graphs with polar coordinates.
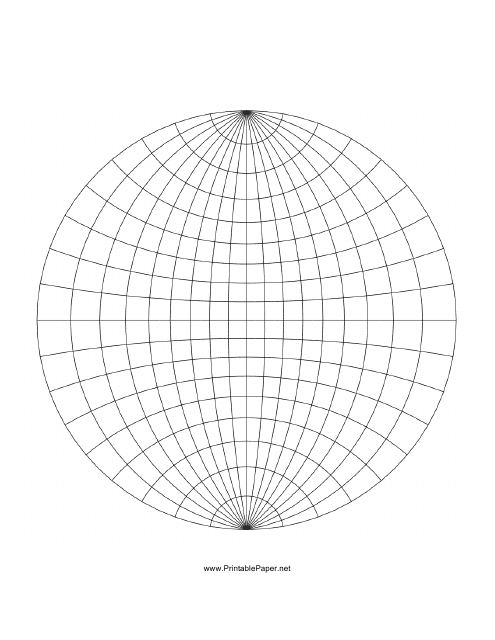
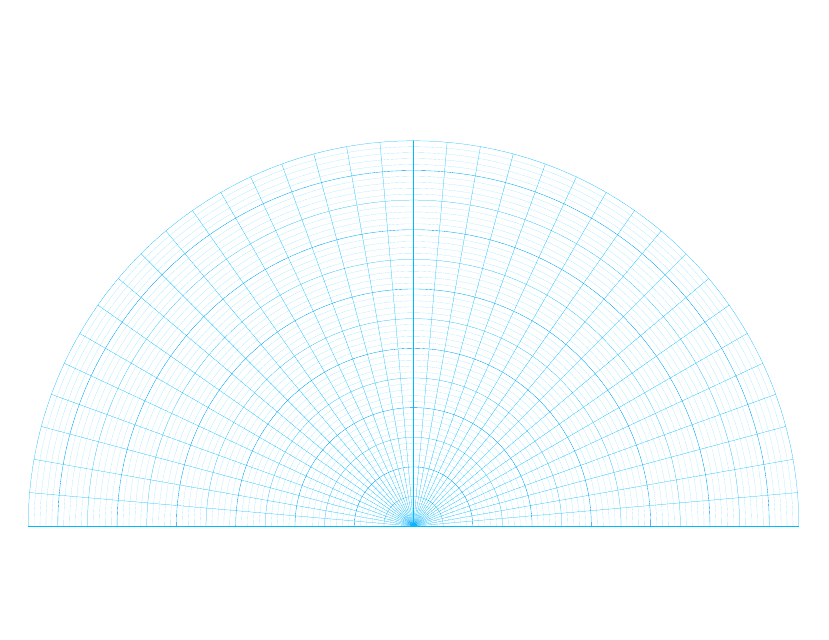
This document provides a printable template for polar graph paper in a spherical form. It is typically used for plotting three-dimensional spherical coordinates in mathematics or physics.
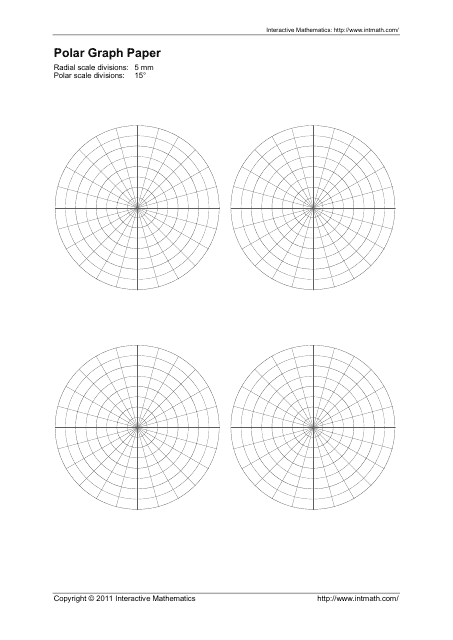
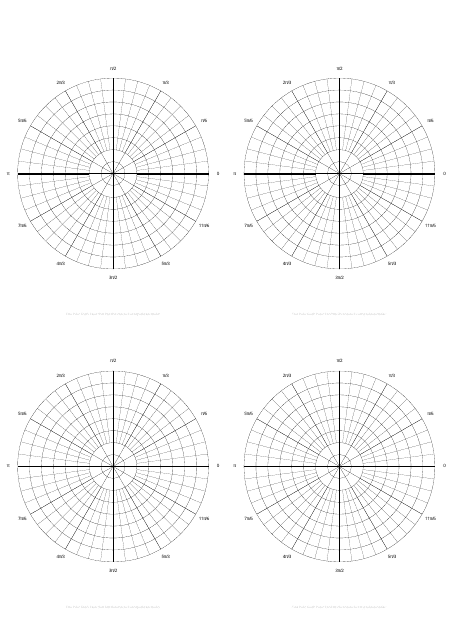
This document serves as a printable template for graphing polar coordinates in a circular format, split into quarters. Ideal for academics, particularly in fields like mathematics and physics where precise graphing is crucial.
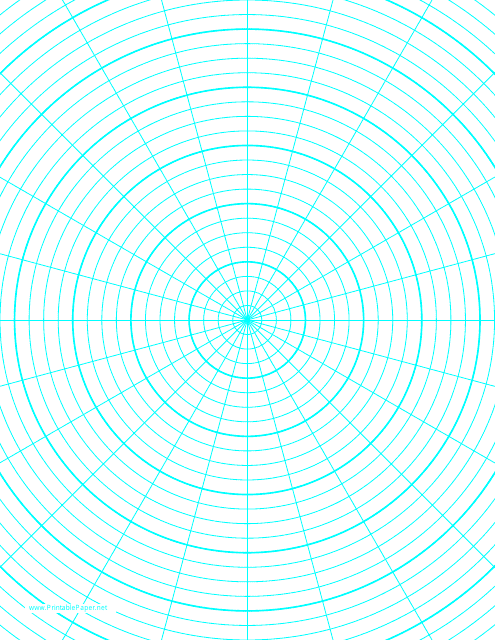
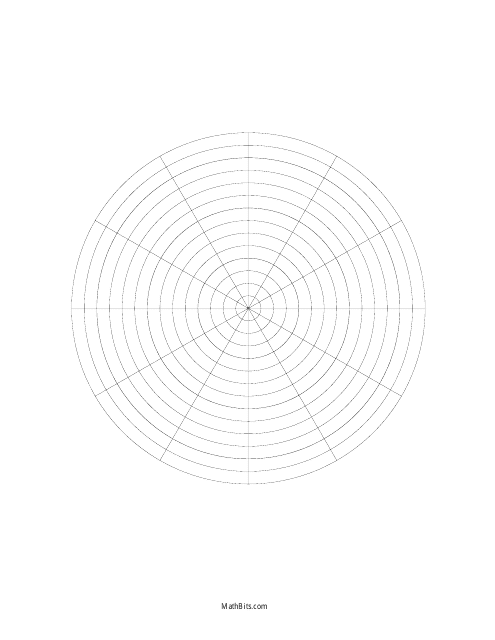
This type of document is often used in mathematics, particularly in trigonometry, to plot polar coordinates and complex numbers, or to create and analyze different types of spiral patterns. The polar graph paper features concentric circles centered around a point, facilitating precise and easy graph plotting.
This type of document provides a specialized grid for drawing wave patterns. The Polar Graph Paper featuring concentric circles is perfect for plotting waves in mathematics, physics, engineering, and other fields.
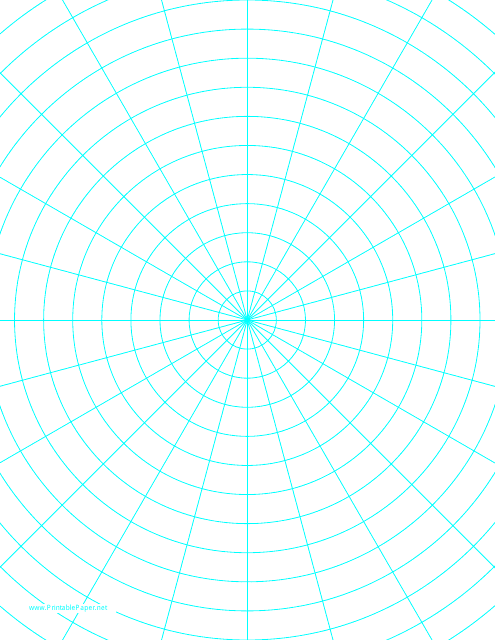
This document is designed for plotting polar coordinates on a grid featuring concentric circles and radial lines, predominantly used in mathematics, physics, engineering, and other related fields.
This document provides a printable version of a Polar Graph Paper, typically used for plotting polar coordinates, recording experimental data or creating designs in subjects like mathematics or physics. The graph is highlighted in black and grey for clear and easy plotting and reading.
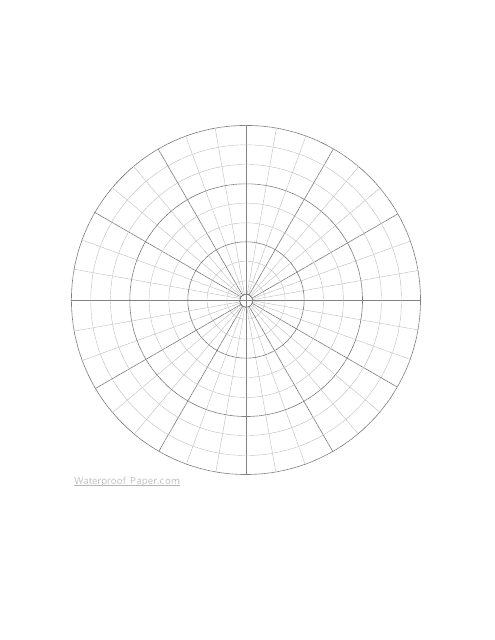
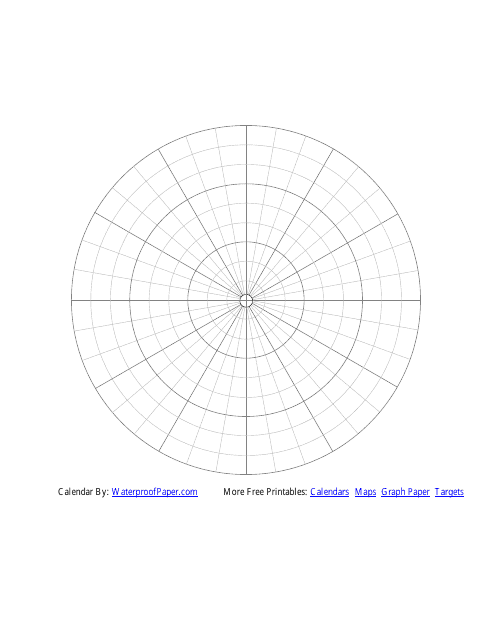
This document is designed to provide waterproof polar graph paper which comes in handy for geometric calculations, navigational & weather data plotting or any mathematical functions requiring polar coordinates, retaining its utility even in wet conditions.
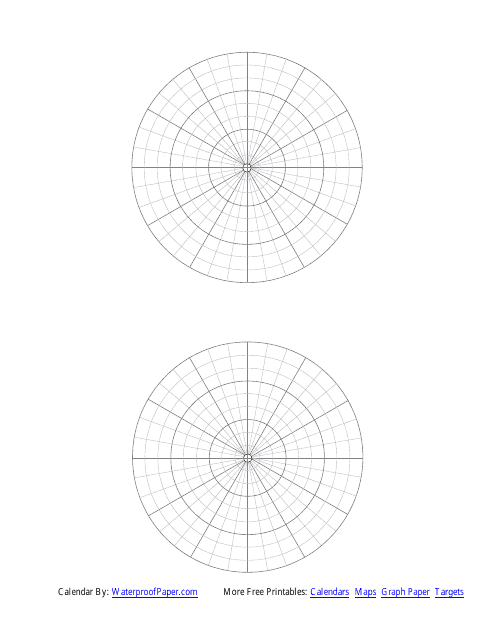
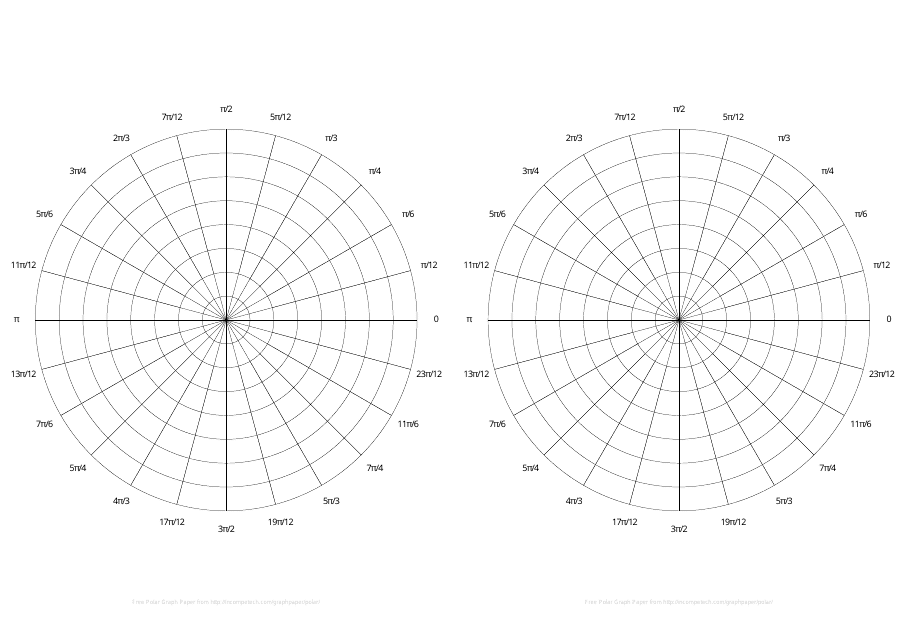
This type of document is a specialized kind of graph paper which is used in mathematics and engineering fields for plotting polar coordinates, graphing, and experimental data. The 'Two Vertical' signifies the presence of two vertical axes for plotting values.
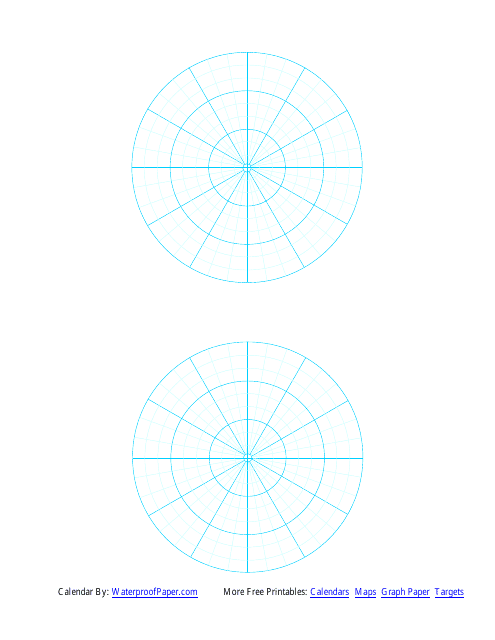
This type of document provides a template of polar graph paper, typically used in mathematics or engineering for clockwise direction graphing with perfect spacing for neat and accurate drawing. Suitable for plotting radial coordinate diagrams, it divides the field into two sectors for added detail and specificity.
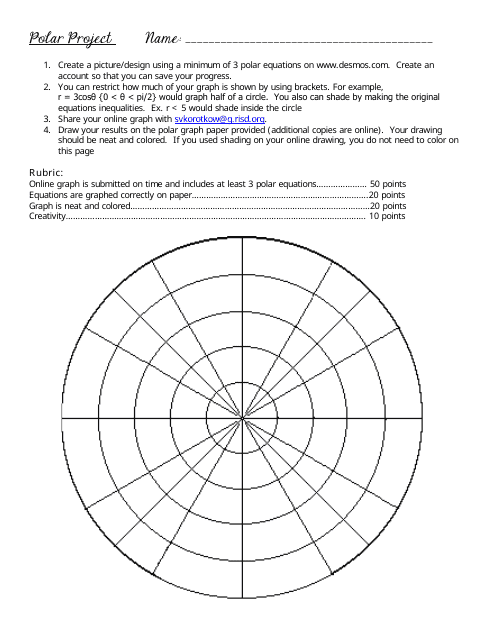
This document provides a full-page polar graph paper, typically used for recording values in a circular format, especially in mathematical and engineering applications. An essential tool for graphing polar coordinates, complex numbers, and patterns.
This document is designed for graphing complex equations in a visually organized way. It's a black & white polar graph paper template that simplifies the task of graphing polar coordinates, often used in mathematics and science studies.