Visual Representation Templates
Are you looking for a way to visually represent data, concepts, or information? Look no further than our comprehensive collection of visually appealing and informative templates. Our visual representation templates are designed to simplify the process of displaying complex data in a visually engaging manner.
Whether you need to create a bar graph, a history timeline, a vocabulary grid, or a part-whole model, our templates have got you covered. Say goodbye to spending hours creating visuals from scratch - our templates provide you with a head start, allowing you to focus on the content rather than the design.
Visual representation is crucial in many fields, including education, business, and research. Our collection of templates will help you communicate your ideas effectively and efficiently. With easy-to-use formats and customizable options, our templates allow you to tailor each visual to suit your specific needs.
No matter your level of expertise, our visual representation templates are suitable for both beginners and advanced users. Whether you're a student, a professional, or an educator, our templates will save you time and effort, enabling you to create stunning visuals with ease.
So why wait? Start exploring our vast selection of visual representation templates and take your data visualization to the next level. With our templates, your visuals will be not only visually appealing but also impactful and informative.
Documents:
13
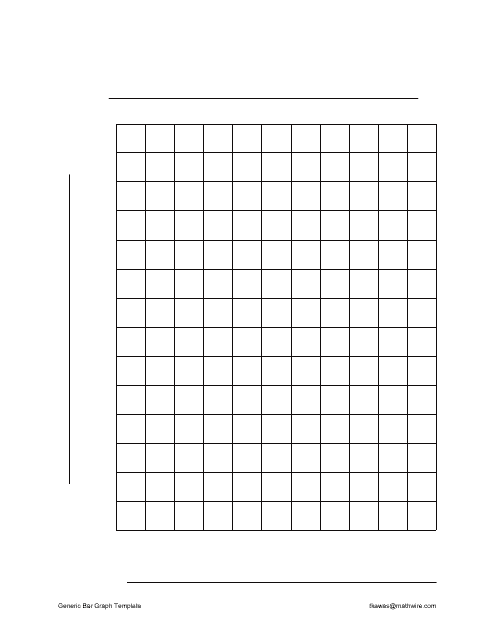
This template is used to create bar graphs for various purposes. It provides a basic layout for organizing data and visualizing trends using bars of different lengths. Customizable and easy to use.
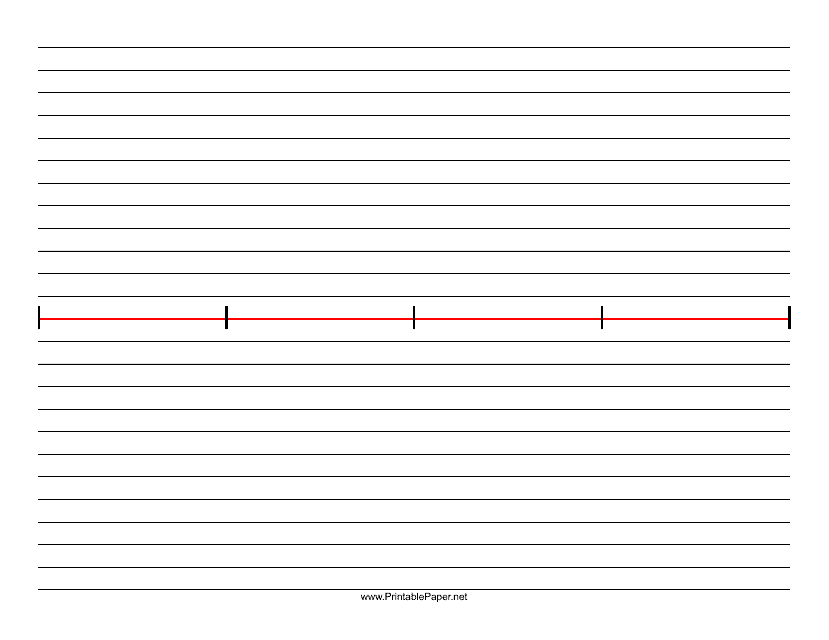
This document is a blank history timeline template that can be used to organize and chronologically display significant events in history. It is helpful for students, educators, and researchers to visually represent historical events in a clear and organized manner.
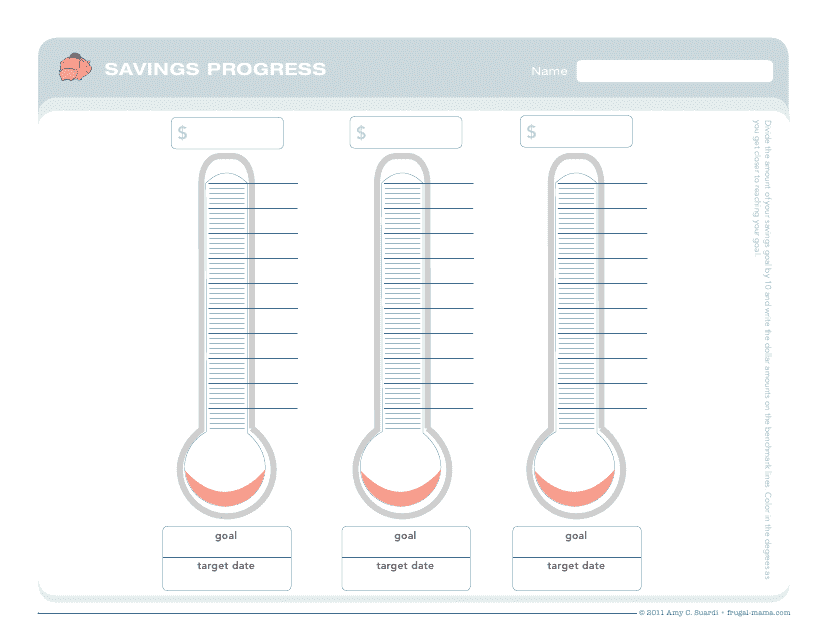
This document is a thermometer goal chart template created by Amy C. Suardi. It can be used to visually track progress towards a specific goal.
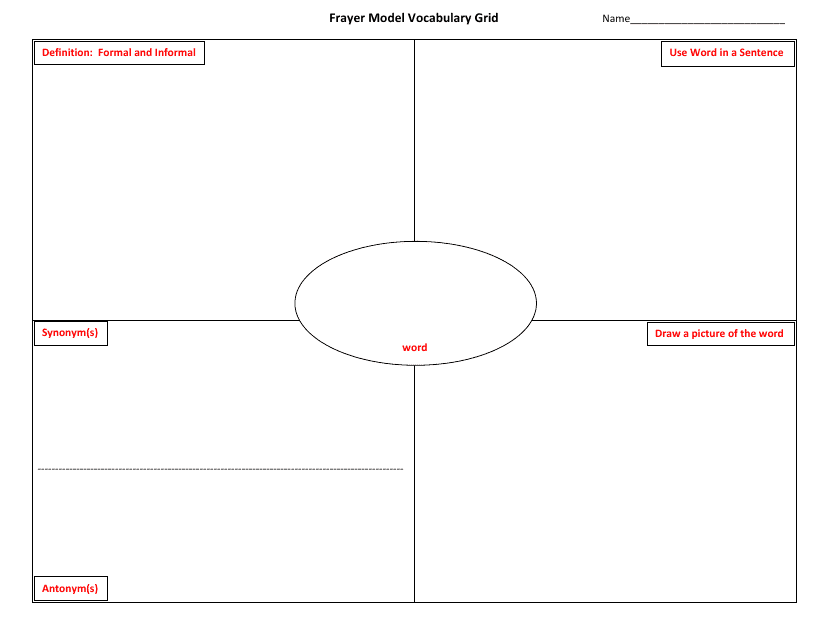
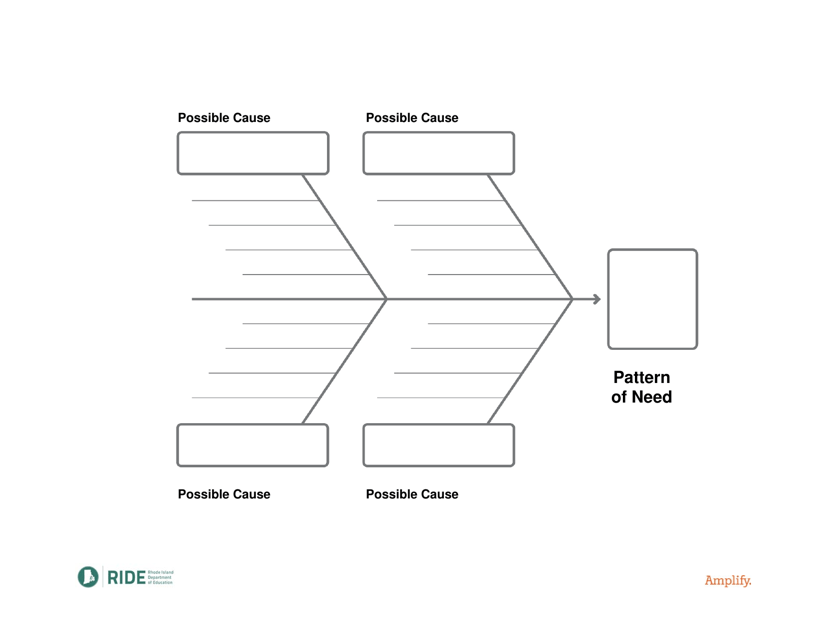
This type of document is a template for creating a vocabulary grid using the Frayer Model. It is a tool used to help students understand and remember new vocabulary words by organizing information and making connections.
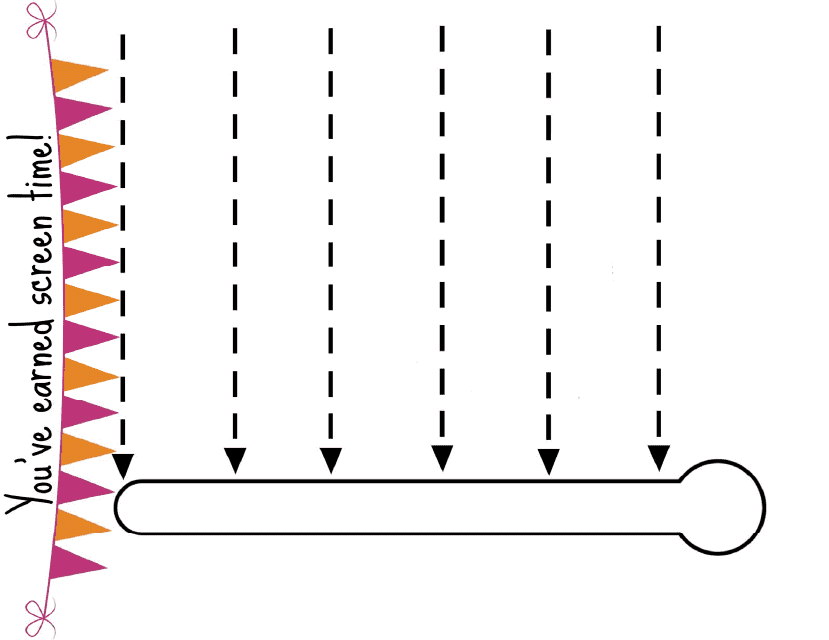
This document provides a template for creating a goal chart with a thermometer visualization.
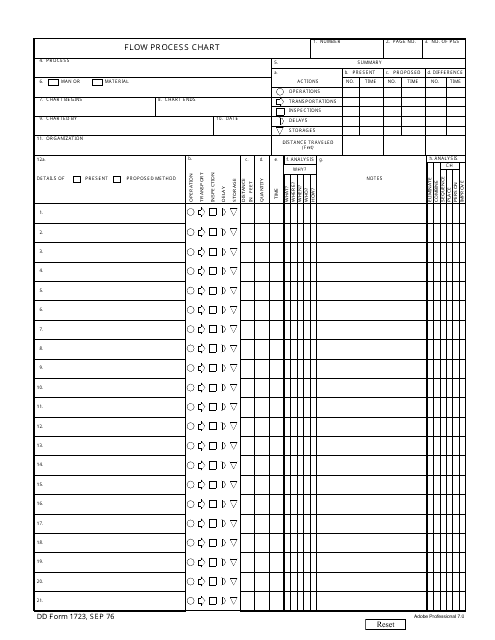
This document provides a flow process chart for DD Form 1723. It helps to visually understand the steps involved in completing the form.
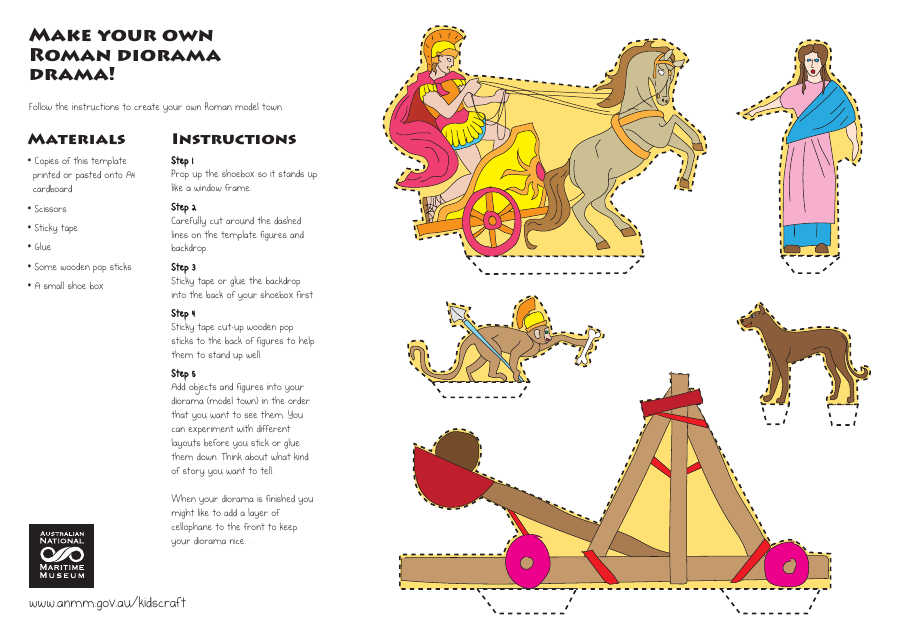
This type of document provides patterns or outlines for creating miniature three-dimensional models or dioramas of Roman architecture, scenes, or figures for educational or decorative purposes.
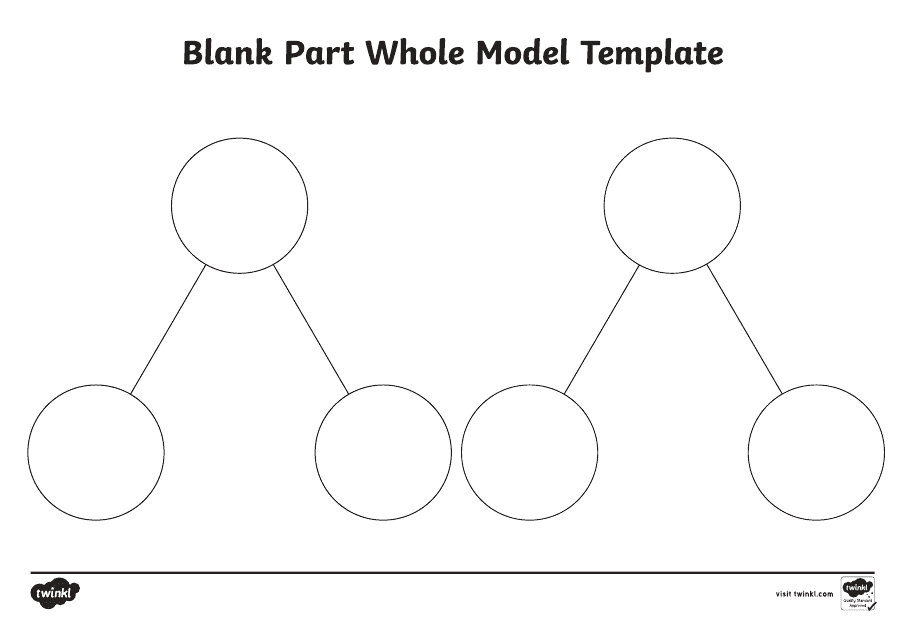
This template is primarily utilized in teaching arithmetic to children. It assists in visualising addition, subtraction, and other mathematical concepts by dividing them into parts and a whole, fostering a better understanding of the subject.