Thermometer Goal Charts
Thermometer Goal Charts are visual tools used to track progress towards a specific goal. They are typically represented by a vertical bar resembling a thermometer, where the height of the bar represents the target amount or goal, and the progress made is indicated by filling in or coloring a portion of the bar. The purpose of a Thermometer Goal Chart is to provide a clear visual representation of progress, motivating individuals or teams to reach their desired target. It can be used for various purposes, such as fundraising campaigns, savings goals, sales targets, or any other objective that can be quantified.
Documents:
10
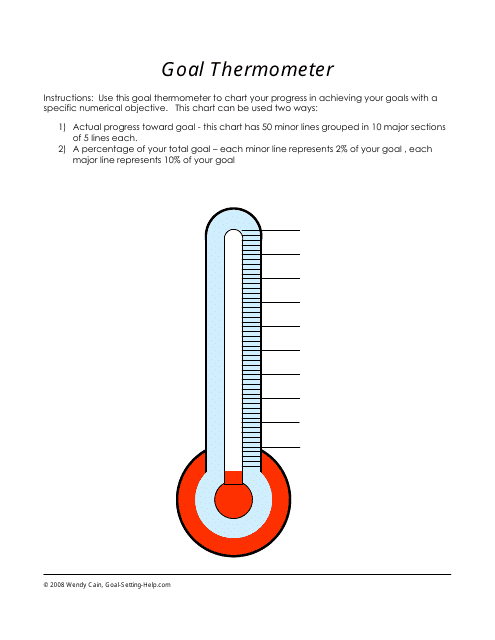
This document is used for tracking and visualizing progress toward achieving temperature-related goals.
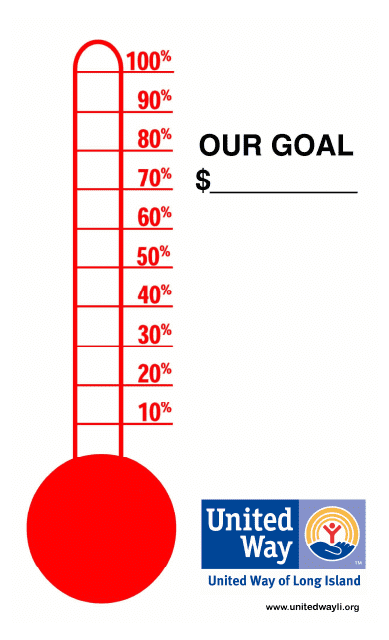
This document is a thermometer goal chart used by the United Way of Goal Island. It helps track progress towards a specific goal.
This document is a template for tracking grades using a thermometer-style visual.
This document is a template that helps track and manage donations. It allows users to record information about donations received, such as the donor's name, amount donated, and date. This helps organizations keep track of their donations and stay organized for reporting and budgeting purposes.
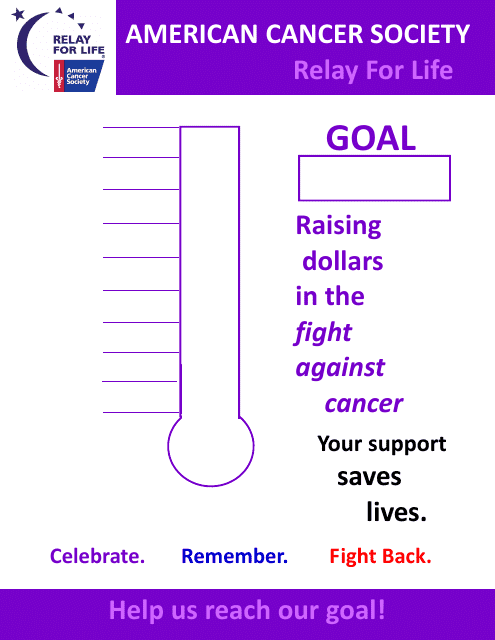
This template is used to track and showcase the progress of fundraising efforts for the American Cancer Society.
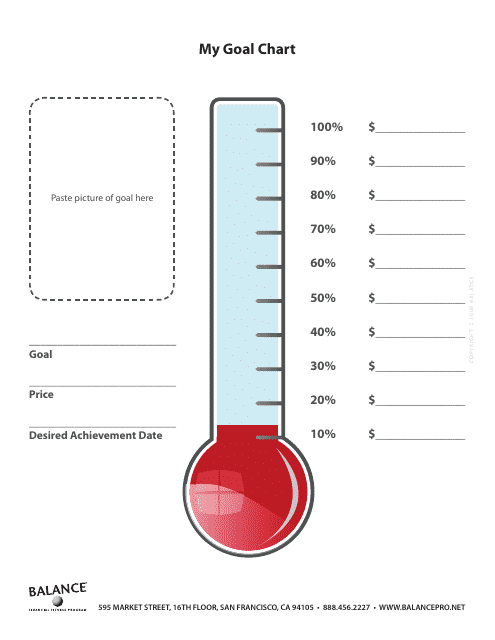
This template is used to track and visually represent progress towards a goal using a thermometer-style chart. It helps users visualize their progress and work towards achieving a balanced outcome.
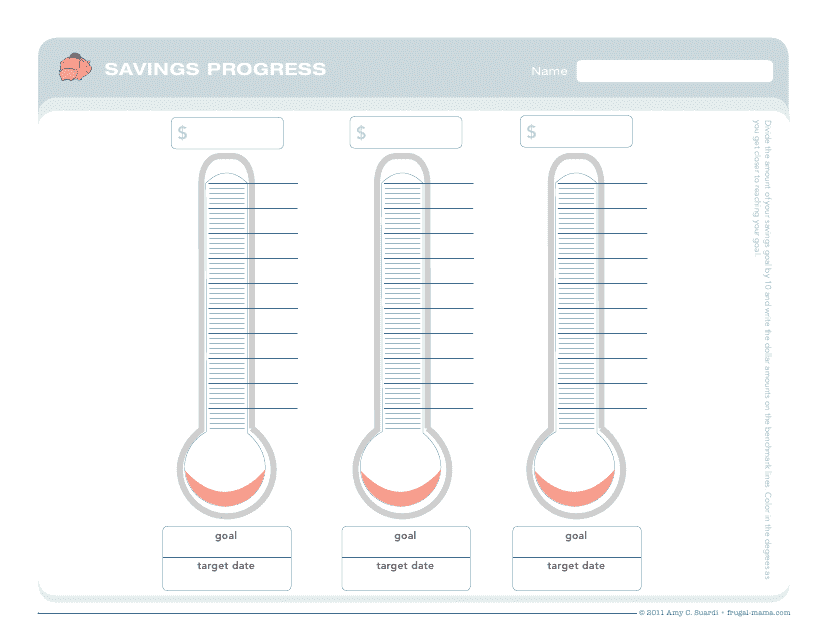
This document is a thermometer goal chart template created by Amy C. Suardi. It can be used to visually track progress towards a specific goal.
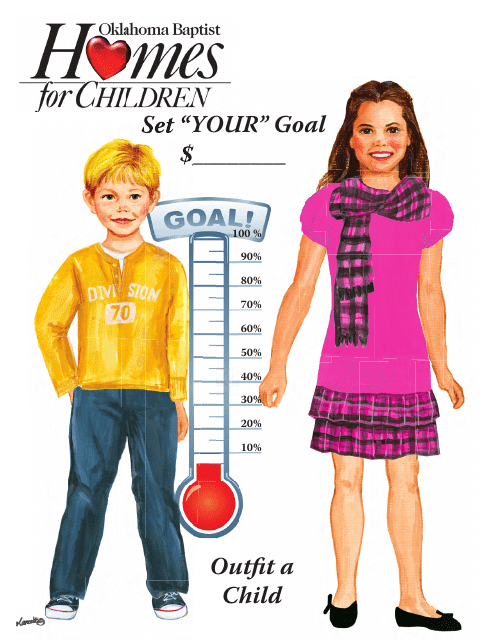
This template helps track and visualize goals using a thermometer chart. It is specifically designed for use by Oklahoma Baptist organizations or individuals.
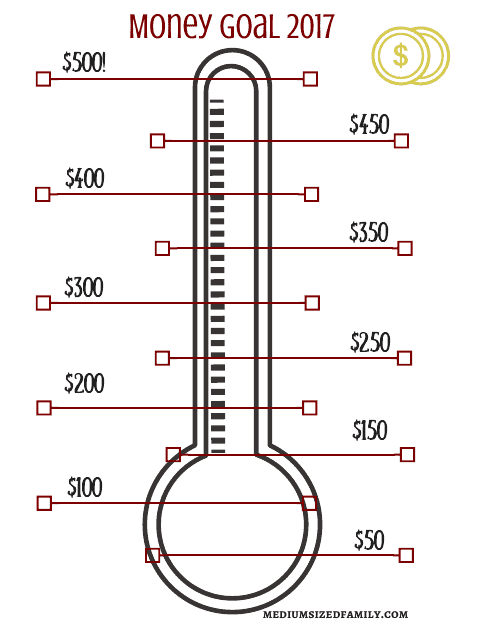
This document serves as a visual tool to track progress towards a monetary goal of $500, represented in the format of a thermometer graphic. It can be used for fundraising, personal savings, or other financial objectives.
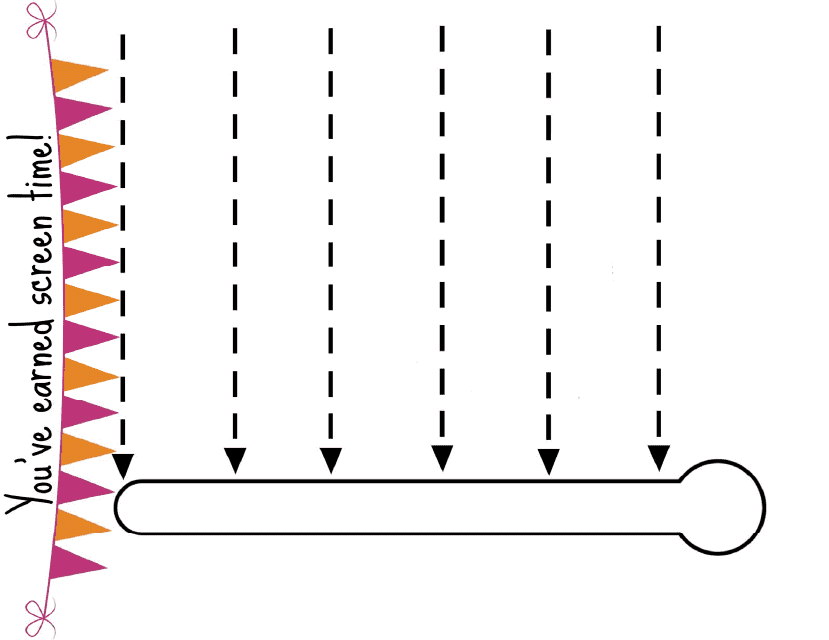
This document provides a template for creating a goal chart with a thermometer visualization.
