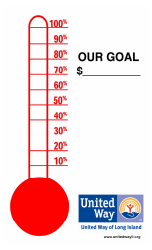
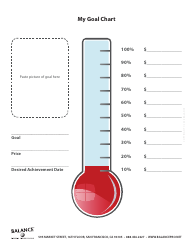
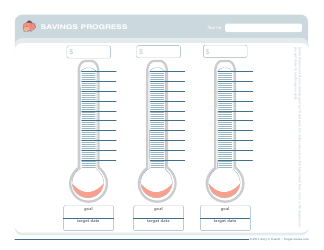
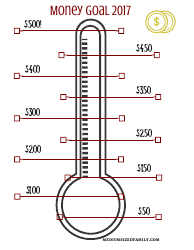
Thermometer Goal Chart

A Thermometer Goal Chart is used to visually track progress towards a specific goal. It shows progress as a thermometer fills up to indicate how close one is to achieving their target. It's often used for fundraising campaigns, savings goals, or any other measurable objective.
FAQ
Q: What is a thermometer goal chart?
A: A thermometer goal chart is a visual way to track progress towards a goal.
Q: How does a thermometer goal chart work?
A: A thermometer goal chart is divided into sections, with each section representing a certain amount of progress towards the goal. As progress is made, the thermometer is filled in to visually represent the increasing level of achievement.
Q: Why are thermometer goal charts popular?
A: Thermometer goal charts are popular because they provide a clear visual representation of progress, which can help motivate and inspire individuals or teams to reach their goals.
Q: What are some common uses of thermometer goal charts?
A: Thermometer goal charts can be used for tracking fundraising goals, savings goals, weight loss goals, sales targets, and various other personal or professional goals.
Q: Are there different types of thermometer goal charts?
A: Yes, there are different types of thermometer goal charts, including horizontal and vertical charts, as well as charts with different designs or themes.