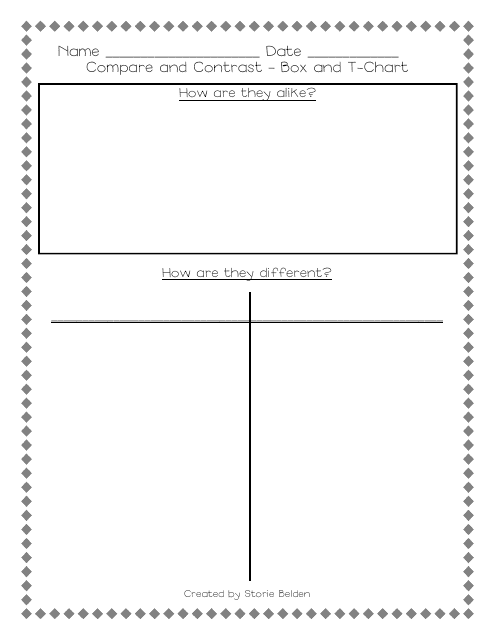
Compare and Contrast Charts
Compare and Contrast Charts are used to analyze the similarities and differences between two or more things. They help organize information in a visual format, making it easier to understand the similarities and differences between different subjects or concepts. These charts are commonly used in academic settings to compare and contrast different ideas, theories, concepts, or objects, and are also useful for organizing information in various professional and personal contexts.