Horizontal Axis Templates
Looking for a convenient way to plot data with logarithmic scales? Look no further than our collection of Log-Log Paper templates with a logarithmic horizontal axis. These templates are designed to make graphing data on logarithmic scales a breeze.
Our Log-Log Paper templates come in a variety of options to suit your needs. Whether you're looking for four decades or just one, we have a template that will work for you. We also offer options with both logarithmic horizontal and vertical axes, ensuring that your graphs are fully optimized for logarithmic scales.
Our Log-Log Paper templates are available in both letter-sized and standard sizes, giving you the flexibility to choose the one that works best for your plotting needs. With equal scales and easy-to-use templates, plotting data on logarithmic scales has never been easier.
Don't waste time trying to manually create logarithmic scales on your graphs. Our Log-Log Paper templates provide a hassle-free way to plot data with logarithmic scales, saving you time and effort. Whether you're a student, researcher, or professional, our Log-Log Paper templates are a must-have tool for accurate and efficient data visualization.
So why wait? Get started with our Log-Log Paper templates and take your graphing to the next level. Explore our collection today and unlock the power of logarithmic scales in your data analysis.
Documents:
6
This document provides a printable version of logarithmic graph paper with both horizontal and vertical axes spanning five decades. Ideal for mathematical and scientific calculations where the scale of data spans several orders of magnitude. It is designed to fit on a standard letter-sized paper.
This type of document serves as a graphing tool with both horizontal and vertical axes in logarithmic scale. It is typically used in various scientific and engineering fields for representing data that cover a large range.
This document is a printable template for log-log graph paper designed on a letter-sized layout. It features both a logarithmic horizontal and vertical axis, each spanning three decades, and is useful for a variety of scientific and engineering calculations.
This document provides a grid for plotting exponential data as per logarithmic scale. It's designed with logarithmic horizontal and vertical axes each spanning three decades. It's beneficial for visualising multiplicative changes or variations.
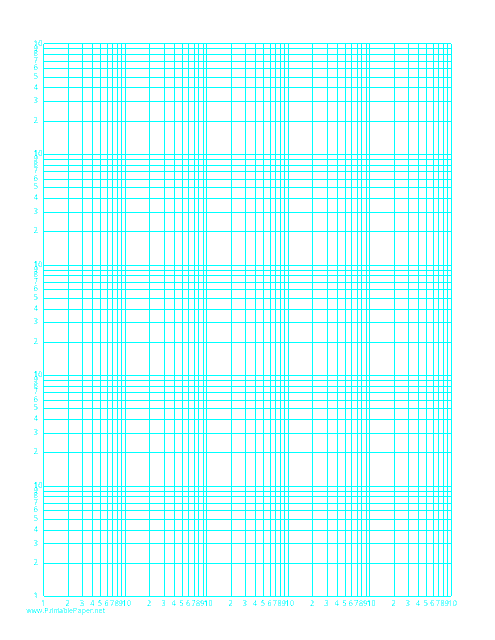
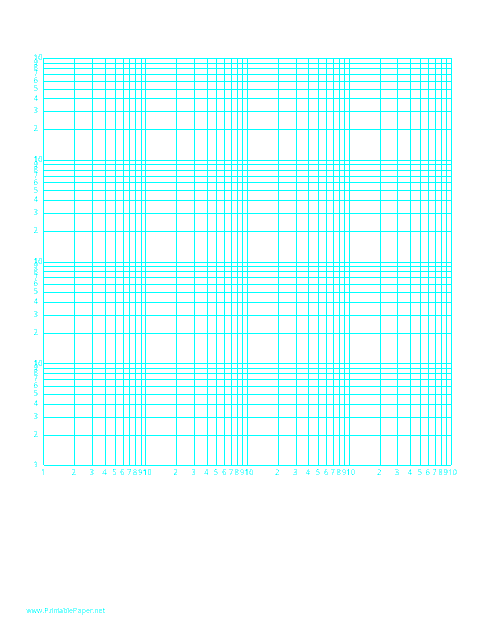
This type of document is designed for mathematical and scientific calculations. It comes with a logarithmic scale on both the horizontal axis (one decade) and vertical axis (five decades) on a standard letter-sized paper. Ideal for representing wide-ranging quantities.
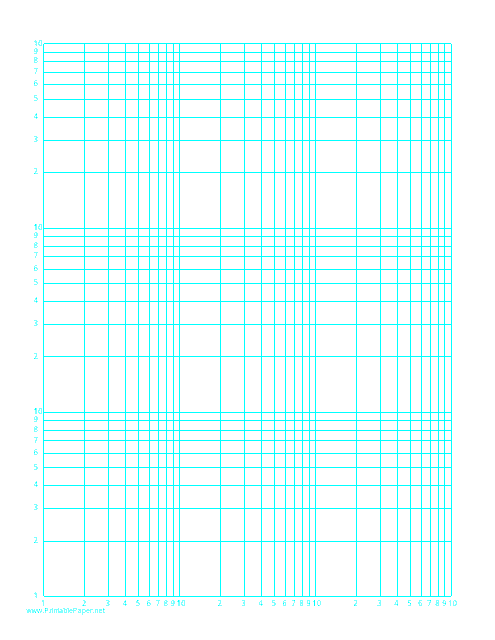
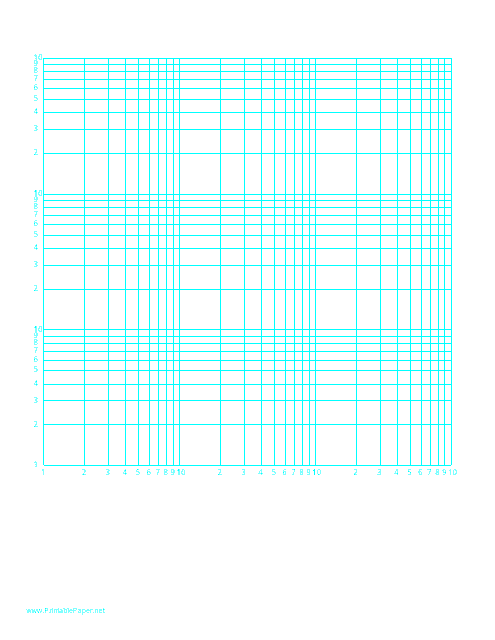
This template is used for plotting data on a logarithmic scale for both the horizontal and vertical axis. The scales are equal and cover one decade, allowing for more precise visualization and comparison of exponential or rapidly-changing data.
