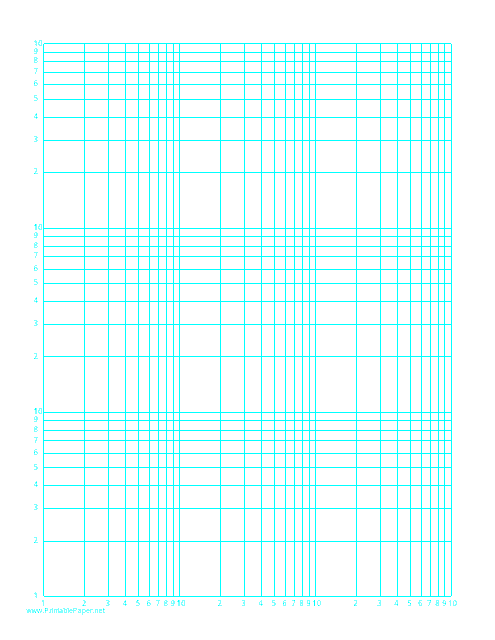
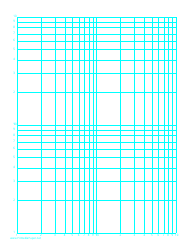
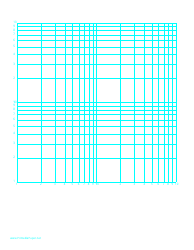
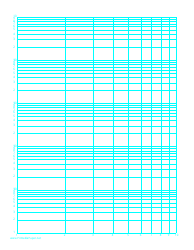
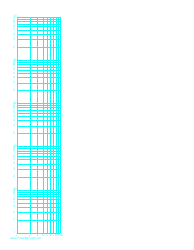
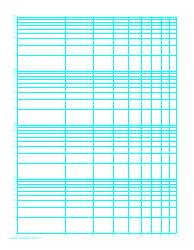
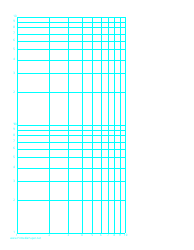
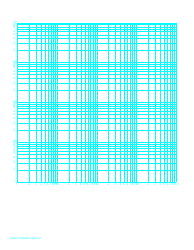
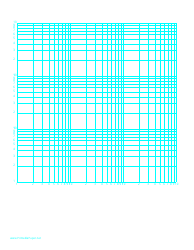
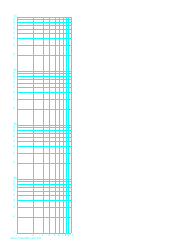
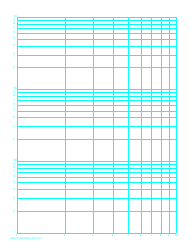
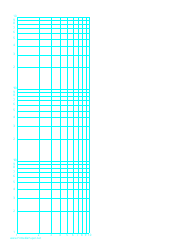
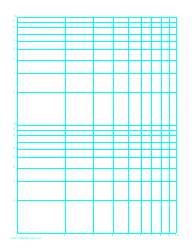
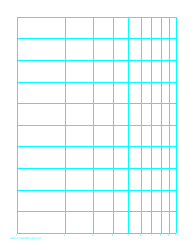
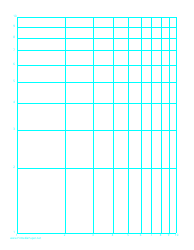
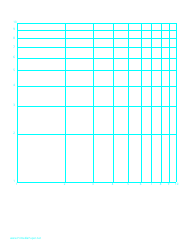
Log-Log Paper With Logarithmic Horizontal Axis (Three Decades) and Logarithmic Vertical Axis (Three Decades) on Letter-Sized Paper
Log-Log Paper With Logarithmic Horizontal Axis (Three Decades) and Logarithmic Vertical Axis (Three Decades) on Letter-Sized Paper is designed for plotting graphs with specific mathematical functions. When both the horizontal and vertical axes are logarithmic, this type of graph paper is referred to as 'log-log' paper.
The "three decades" on both axes indicate a range in the log scale where each cycle on the graph represents a ten-fold increase.
The benefits of using log-log paper include being able to display and analyze data that cover a wide range of values in a compact space, and to reveal certain types of relationships between variables that may not be readily apparent in other types of plots, such as linear or semilog plots. It is often used in fields such as engineering, physics, and mathematics.
The Log-Log Paper with Logarithmic Horizontal Axis (Three Decades) and Logarithmic Vertical Axis (Three Decades) on Letter-Sized Paper isn't typically filed by a certain person or entity. It is a type of graph paper used by mathematicians, scientists, engineers or students who are dealing with exponential data or trying to represent a logarithmic scale visually on a graph. Anyone who needs this type of graph paper for mathematical or scientific purpose can use it.
FAQ
Q: What is log-log paper with logarithmic horizontal and vertical axis?
A: Log-log paper is a type of graph paper that uses a logarithmic scale on both the horizontal and vertical axes. In the context of 'Three Decades', it means each axis covers a range of three orders of magnitude (1 to 1000). This paper is often used in science and engineering to display data that spans multiple orders of magnitude, such as in case of earthquake seismic data or electronic circuits.
Q: What do 'Three Decades' mean in relation to logarithmic axes?
A: 'Three Decades' in log-log paper describes the range of the scales on each axis of the graph. A decade is a tenfold increase in values. Therefore, 'Three Decades' means the data on each axis ranges over three powers of ten (e.g., from 1 to 1000).
Q: What is the purpose of using a log-log graph paper?
A: Log-log graph paper is used in fields such as biology, geology, physics, and economics, where one needs to graph data that varies exponentially or over a wide range of levels. The advantage of using a log-log graph paper is that it allows visualizing and working with data that includes both very small and very large numbers.
Q: What does 'Letter-Sized Paper' mean in this context?
A: 'Letter-Sized Paper' is a standard paper size in the United States and Canada. It measures 8.5 x 11 inches. When referred to log-log paper, it means the graph paper is designed to fit this size.
Q: How is data plotted on log-log paper?
A: On a log-log paper, data values are not plotted as they are but rather as their logarithms. For any data point (x, y) on the graph, the actual plot position relates to log(x) and log(y). This process compresses the scale so extreme values can fit within the plotted area.
