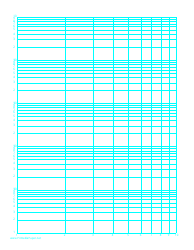
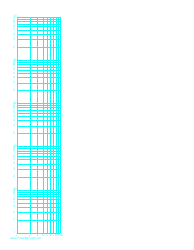
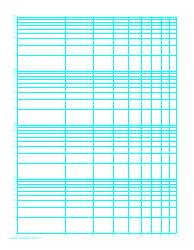
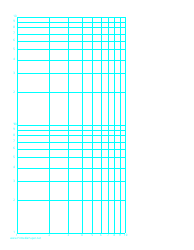
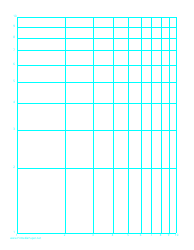
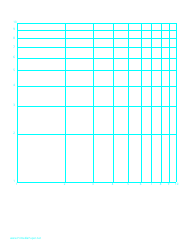
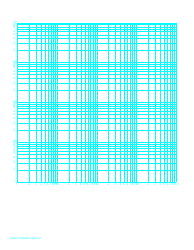
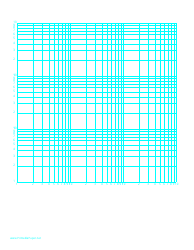
Cyan Log-Log Paper Template (Logarithmic Horizontal Axis on One Decade, Logarithmic Vertical Axis on Two Decades)

Cyan log-log paper template with a logarithmic horizontal axis on one decade and a logarithmic vertical axis on two decades is used for plotting data that have a wide range of values. It allows for a more convenient visualization and analysis of exponential relationships between variables.
FAQ
Q: What is a Cyan Log-Log Paper Template?
A: A Cyan Log-Log Paper Template is a type of graph paper that has a logarithmic horizontal axis spanning one decade, and a logarithmic vertical axis spanning two decades.
Q: What is the purpose of a Cyan Log-Log Paper Template?
A: The purpose of a Cyan Log-Log Paper Template is to plot data that spans a wide range of values and needs to be displayed on a logarithmic scale.
Q: How does a Cyan Log-Log Paper Template differ from regular graph paper?
A: A Cyan Log-Log Paper Template has logarithmic scales on both the horizontal and vertical axes, whereas regular graph paper usually has linear scales.
Q: What are the benefits of using Cyan Log-Log Paper?
A: Using Cyan Log-Log Paper allows for the visualization of data that spans multiple orders of magnitude, making it easier to analyze trends and patterns.
Q: Is a Cyan Log-Log Paper Template suitable for all types of data?
A: No, a Cyan Log-Log Paper Template is most suitable for data that spans a wide range and needs to be plotted on a logarithmic scale. For data that is more evenly distributed, regular graph paper may be more appropriate.