Behavior Frequency Charts
Behavior Frequency Charts are used to visually represent the frequency of specific behaviors or actions within a given time period. These charts allow users to track and analyze patterns of behavior over time, enabling them to identify trends and make informed decisions based on the data. They are often used for behavioral analysis, research, data collection, and tracking progress towards goals.
Documents:
1
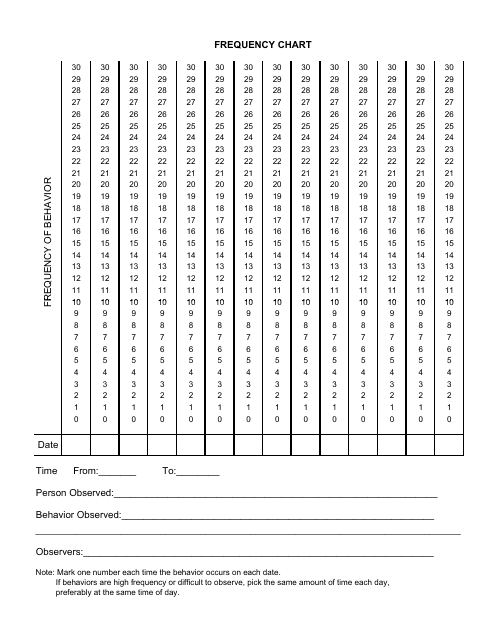
This document provides a template for creating a chart that displays the frequency of different behaviors. Use this template to track and analyze behavior patterns.
