Frequency Charts
Frequency charts are used to visually represent the occurrence or distribution of data across different categories or intervals. They help to organize and summarize data to identify patterns, trends, or relationships. Frequency charts are often used in various fields, such as statistics, research, data analysis, and quality control, to provide a clear understanding of the frequency or occurrence of specific events or data points.
Documents:
2
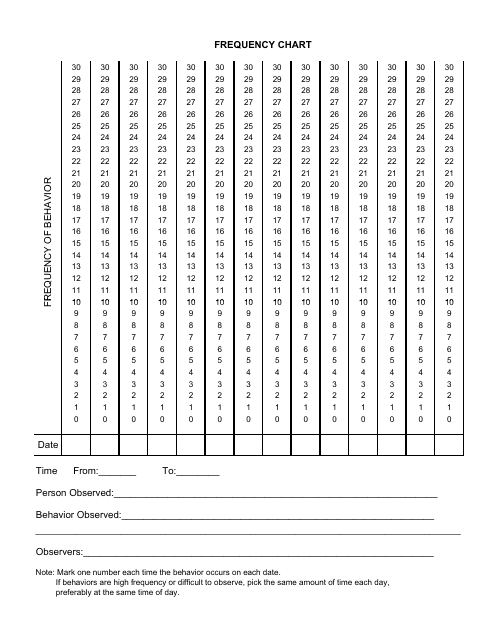
This document provides a template for creating a chart that displays the frequency of different behaviors. Use this template to track and analyze behavior patterns.
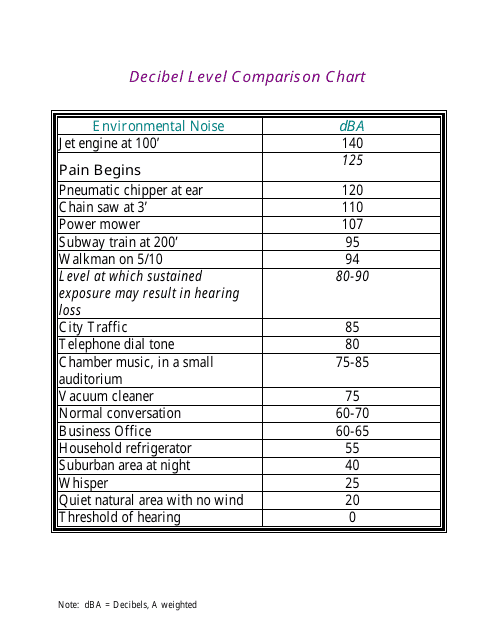
This type of document provides a chart that compares different decibel levels. It is used to understand the differences in sound intensity for various everyday sounds and environments.
