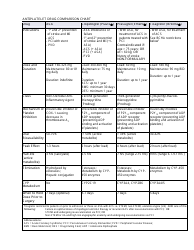
Decibel Level Comparison Chart

A decibel level comparison chart is used to show the relative loudness of different sounds or noise levels. It helps people understand the intensity of sound in terms of decibels (dB) and provides examples of common noise sources at various dB levels.
The Decibel Level Comparison Chart is typically compiled and maintained by organizations or agencies responsible for measuring and regulating noise levels, such as environmental protection agencies or local governments.
FAQ
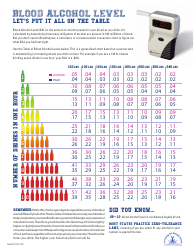
Q: What is a decibel level?
A: A decibel level is a unit of measurement for sound intensity.
Q: What are some examples of decibel levels?
A: Examples of decibel levels include a quiet library (30 dB), normal conversation (60 dB), a lawnmower (90 dB), and a rock concert (120 dB).
Q: How loud is a normal conversation?
A: A normal conversation has a decibel level of around 60 dB.
Q: How loud is a lawnmower?
A: A lawnmower has a decibel level of around 90 dB.
Q: How loud is a rock concert?
A: A rock concert can have a decibel level of around 120 dB.
Q: What are some common sound levels and their effects on hearing?
A: Some common sound levels and their effects on hearing are: 85 dB (prolonged exposure may cause hearing damage), 100 dB (hearing damage possible after 15 minutes), and 120 dB (painful and can cause immediate hearing damage).
Q: What is the recommended maximum exposure time for different decibel levels?
A: The recommended maximum exposure time for 85 dB is 8 hours, for 90 dB it is 2 hours, for 100 dB it is 15 minutes, and for 110 dB or higher it is less than 1 minute.
Q: What are some ways to protect hearing from loud noises?
A: Some ways to protect hearing from loud noises include using earplugs or earmuffs, keeping a safe distance from the noise source, and taking breaks from exposure to loud sounds.