Sound Frequency Charts
Sound Frequency Charts are used to display the range of frequencies that can be heard by humans. These charts provide a visual representation of the different frequencies of sound, typically displayed in a graph format. They are used in various fields such as music, audio engineering, and audiology to understand the range of frequencies that can be perceived by the human ear. The chart helps to identify different sound frequencies and their corresponding pitch or tone.
Documents:
1
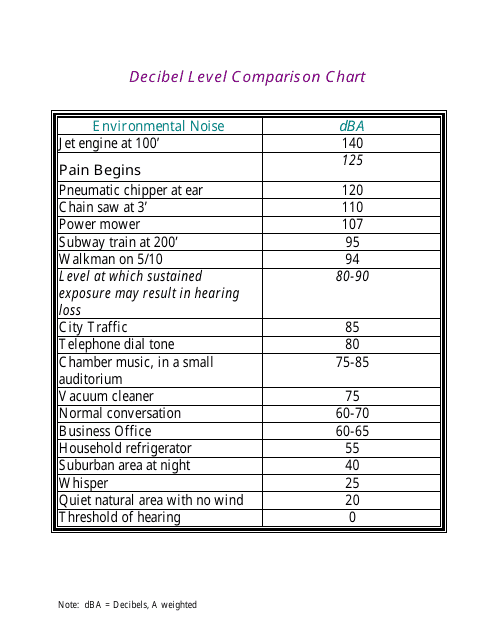
This type of document provides a chart that compares different decibel levels. It is used to understand the differences in sound intensity for various everyday sounds and environments.
