Decimal Charts
Decimal charts are commonly used as reference tools to help visualize and understand the decimal system. They provide a visual representation of decimal values, typically from 0 to 1 or 0 to 10, and show the corresponding fractions and percentages for each decimal. Decimal charts are helpful for tasks such as converting between decimals, fractions, and percentages, as well as for practicing decimal operations and solving mathematical problems involving decimal values.
Documents:
2
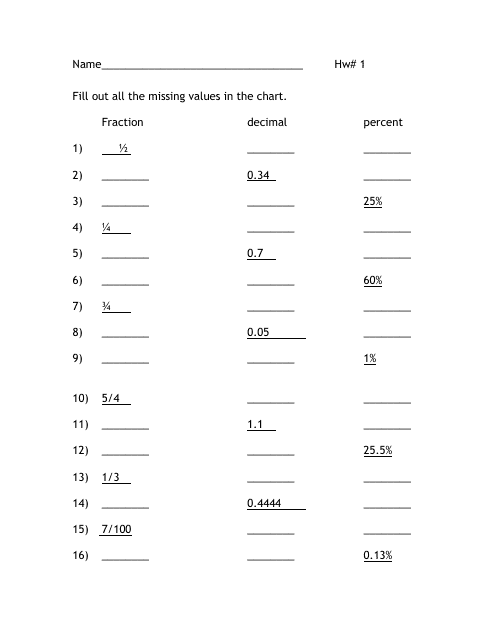
This worksheet helps you practice working with fractions, decimals, and percentages.
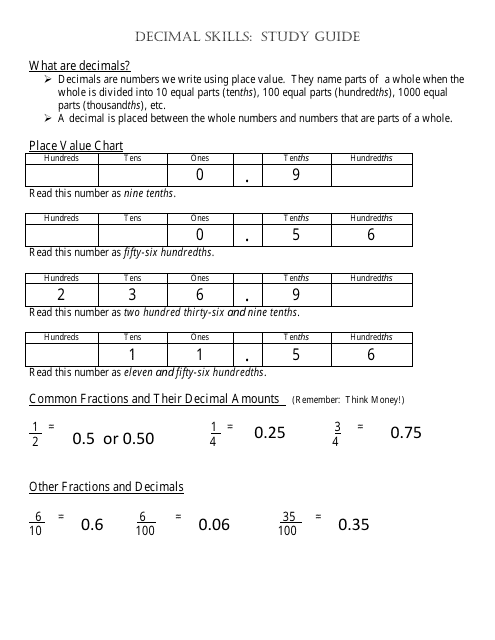
This study guide is designed to help improve your decimal skills. It provides helpful tips, practice exercises, and examples to enhance your understanding of decimal numbers.
