Depth Charts
Depth charts are visual representations that provide a hierarchical structure or a visual overview of the different levels or layers within a particular topic or subject. They are used to showcase the complexity, depth, and intricacy of a subject matter by breaking it down into various components or dimensions. These charts can be utilized in various fields such as education, sports, photography, and other areas where understanding the different layers or levels of a subject is important.
Documents:
3
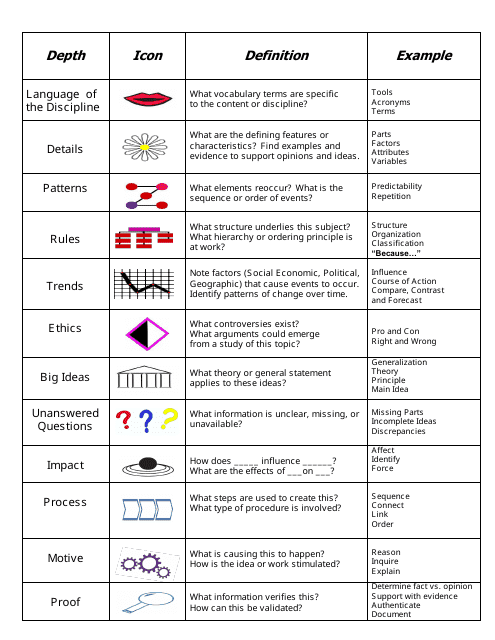
This document is a chart that uses a depth and complexity framework to analyze and understand complex topics or concepts. It provides a visual representation of the depth and complexity of information, allowing for a more comprehensive understanding.
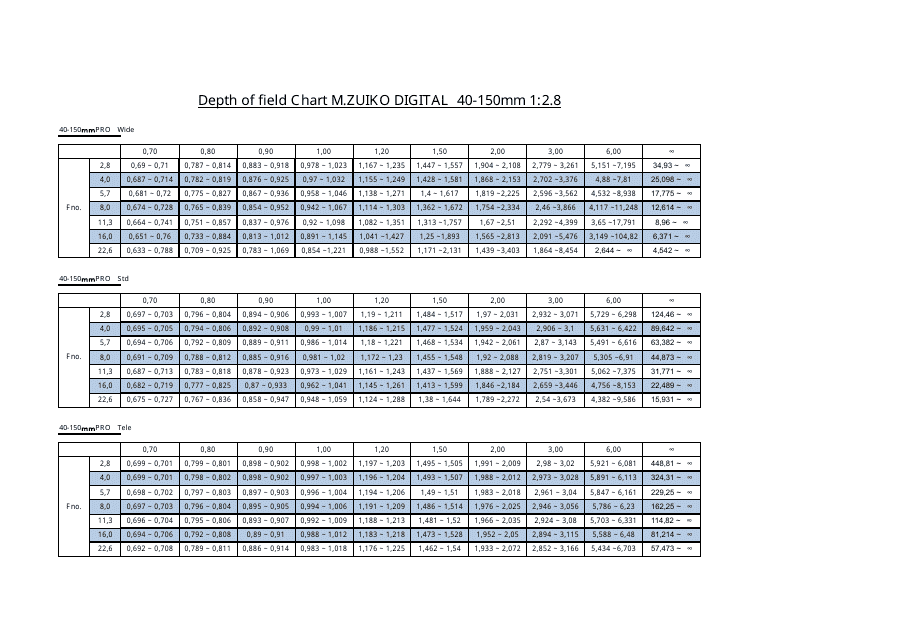
This chart provides information on the depth of field for the M.zuiko Digital 40-150mm lens with an aperture of 1:2.8. It helps photographers understand how much of a scene will be in focus at different focal lengths and distances.
This document describes a depth and complexity icon chart that is used to enhance critical thinking and analyze complex ideas in various subjects.
