Hemoglobin A1c Numbers Chart
]")
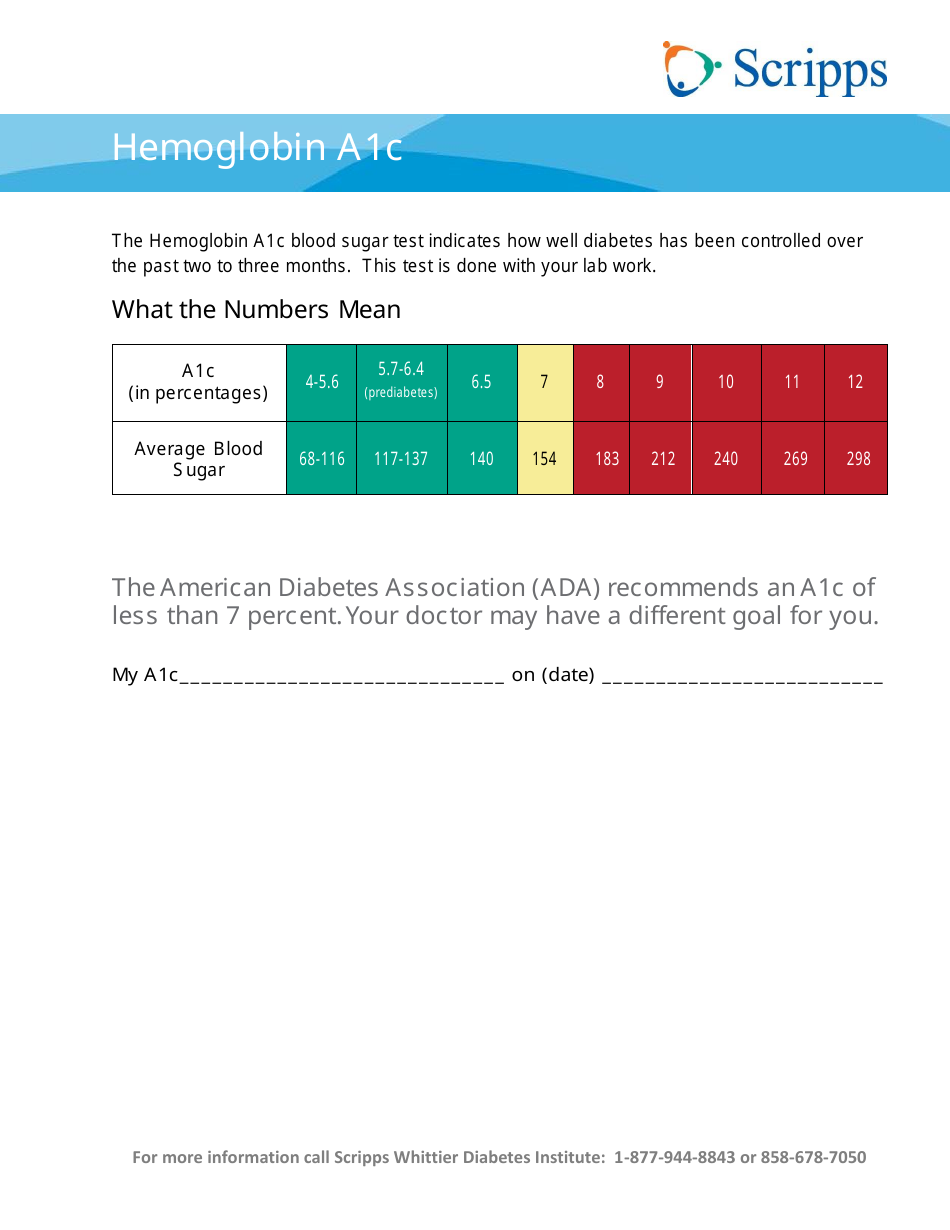
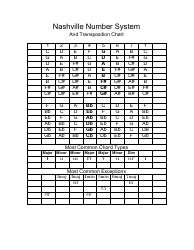
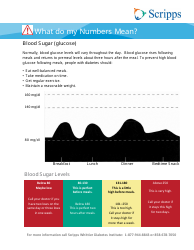
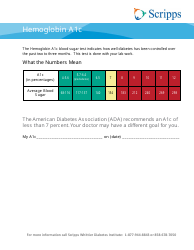
A Hemoglobin A1c Numbers Chart is used as a reference to assess the long-term control of blood glucose levels in people with diabetes. Hemoglobin A1c (HbA1c) is a form of hemoglobin that is chemically linked to a sugar. The higher the level of glucose in the blood, the higher the level of HbA1c. This is important because red blood cells live for about 3 months, so the HbA1c test provides an average of your blood sugar levels over the past few months. The chart typically lists HbA1c levels on one side and what those levels translate to in terms of average blood sugar levels. It's a valuable tool for both patients and healthcare providers in managing diabetes treatment plans.
The Hemoglobin A1c Numbers Chart is typically filed by healthcare professionals such as doctors, nurse practitioners, or diabetic educators who are managing a patient's diabetes care. It's not specific to any country, as it's used worldwide to monitor long-term glucose control in people with diabetes. For the average US resident, you might see this chart during visits to your healthcare provider if you are managing diabetes.
FAQ
Q: What is a Hemoglobin A1c Numbers Chart?
A: A Hemoglobin A1c Numbers Chart is a tool that healthcare providers use to monitor a person's average blood sugar levels over a period of two to three months.
Q: What does a Hemoglobin A1c Numbers Chart indicate?
A: It indicates the percentage of blood sugar attached to the Hemoglobin. Higher percentages indicate poor diabetes control and a higher risk of complications related to diabetes.
Q: What are the normal values on the Hemoglobin A1c Numbers Chart?
A: For people without diabetes, the normal range for the Hemoglobin A1c level is between 4% and 5.6%. A1c levels between 5.7% and 6.4% indicate increased risk of diabetes, and levels of 6.5% or higher indicate diabetes.
Q: What does a high A1c level mean?
A: A high A1c level on the Hemoglobin A1c Chart indicates that your blood sugar control has not been good over the last few months and that you may need to adjust your diabetes treatment plan.
Q: Does a lower A1c level mean better diabetes control?
A: Yes, a lower A1c level on the chart indicates that your body has a better control over your blood sugar levels.
Q: Can Hemoglobin A1c numbers determine prediabetes?
A: Yes, Hemoglobin A1c Numbers can help in determining prediabetes. A1c levels between 5.7% to 6.4% indicate prediabetes.
Q: How often should the Hemoglobin A1c test be done?
A: The test is generally done every 2 to 3 months for people with type 1 and type 2 diabetes.
Q: What can affect Hemoglobin A1c levels?
A: Several factors can affect Hemoglobin A1c levels including diet, physical activity, medications, illness, stress, and changes in hormone levels.
Download Hemoglobin A1c Numbers Chart
1
2
]")