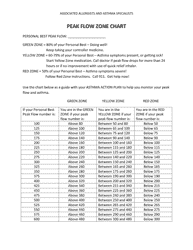
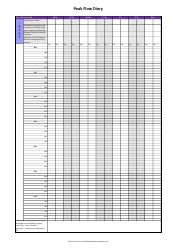
Peak Flow Zones Chart - Pediatric Associates

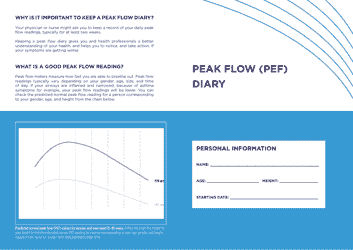
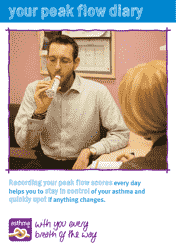
The Peak Flow Zones Chart is used by Pediatric Associates to help children monitor their asthma symptoms and determine the appropriate course of action based on their peak flow measurements. It helps in managing asthma symptoms and reducing the risk of asthma attacks.
FAQ
Q: What is a peak flow zones chart?
A: A peak flow zones chart is a tool used to monitor the severity of asthma symptoms.
Q: What is the purpose of a peak flow zones chart?
A: The purpose of a peak flow zones chart is to help manage asthma by tracking changes in lung function.
Q: How does a peak flow zones chart work?
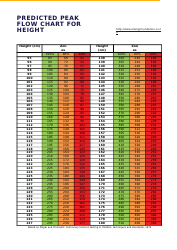
A: A peak flow zones chart uses peak flow readings, which measure how much air you can exhale forcefully, to determine asthma severity.
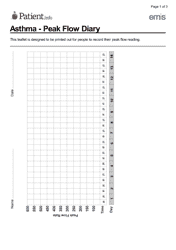
Q: What are the different zones on a peak flow zones chart?
A: A peak flow zones chart typically has three color-coded zones: green, yellow, and red.
Q: What does the green zone on a peak flow zones chart mean?
A: The green zone on a peak flow zones chart indicates good or stable asthma control.
Q: What does the yellow zone on a peak flow zones chart mean?
A: The yellow zone on a peak flow zones chart indicates caution or worsening asthma symptoms.
Q: What does the red zone on a peak flow zones chart mean?
A: The red zone on a peak flow zones chart indicates a medical emergency and signals severe asthma symptoms.
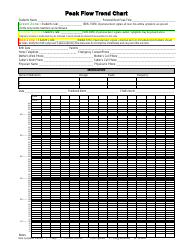
Q: How often should peak flow readings be taken?
A: Peak flow readings should be taken as instructed by a healthcare provider. Generally, it is recommended to take readings at least twice a day.
Q: Who can use a peak flow zones chart?
A: A peak flow zones chart can be used by individuals, including children, who have been diagnosed with asthma.
Q: Why is it important to use a peak flow zones chart?
A: Using a peak flow zones chart helps individuals with asthma track their lung function and adjust their treatment plan accordingly.