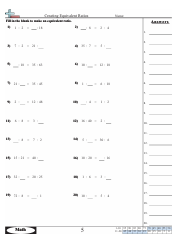
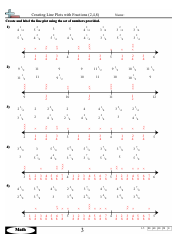
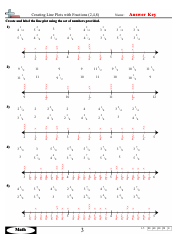
Creating Line Plots With Fractions (2, 4, 8) Worksheet With Answers
\" Worksheet With Answers, showing a graphical representation of line plots with fractions. Ideal for enhancing understanding and learning about representing fractions with line plots.")
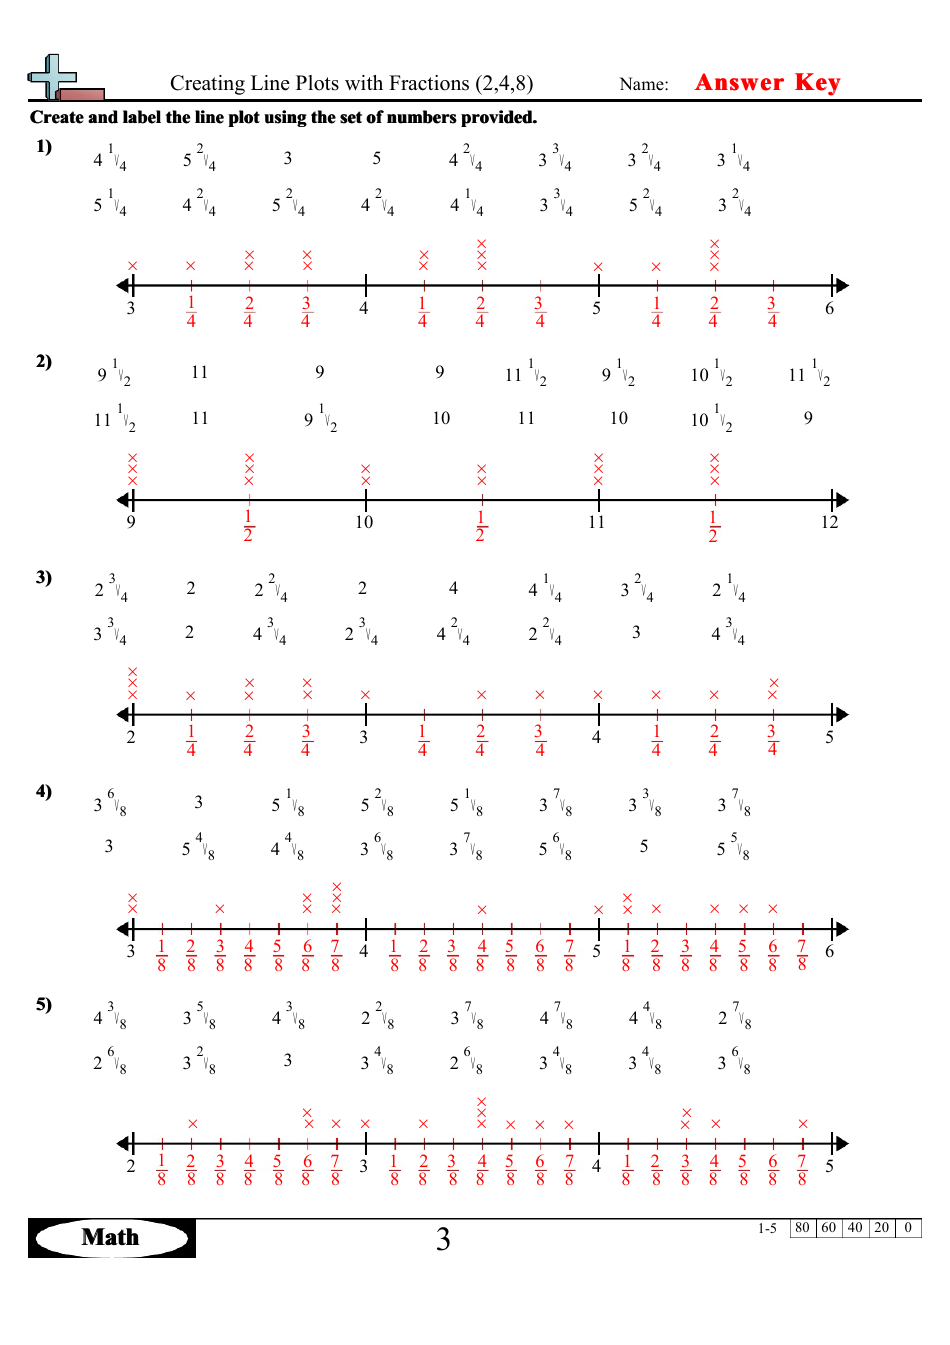
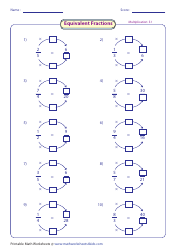
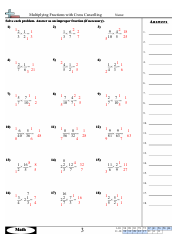
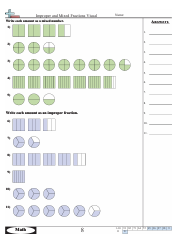
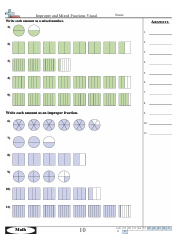
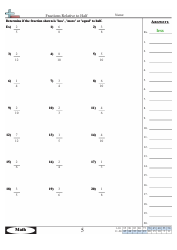
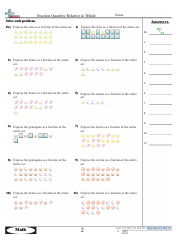
Creating Line Plots With Fractions (2, 4, 8) Worksheet With Answers is a resource for students to practice representing data on a line plot using fractions. It provides exercises and their corresponding answers to help students understand and master this skill.
The Creating Line Plots With Fractions (2, 4, 8) worksheet with answers can be filed by teachers or educators who use it in their classroom.
FAQ
Q: What is a line plot?
A: A line plot is a graph that uses a number line to show the frequency of different data points.
Q: How do you create a line plot with fractions?
A: To create a line plot with fractions, you mark the number line with the fractions and then plot a dot or symbol above the number for each occurrence of that fraction in the data.
Q: What is the purpose of a line plot?
A: Line plots help visualize and analyze data by showing the distribution and frequency of different values or fractions.
Q: How can line plots with fractions be useful?
A: Line plots with fractions can help identify the most common or least common fractions in a set of data. They can also show patterns, trends, or outliers in the data.
Q: How do you read a line plot with fractions?
A: To read a line plot with fractions, you look at the number line and determine the frequency or number of occurrences of each fraction based on the dots or symbols above the numbers.
Download Creating Line Plots With Fractions (2, 4, 8) Worksheet With Answers
1
2
\" Worksheet With Answers, showing a graphical representation of line plots with fractions. Ideal for enhancing understanding and learning about representing fractions with line plots.")