Circle Charts
Circle charts are used for visual representation and organization of data, often in a circular format. They can be used for various purposes, including displaying proportions, percentages, or relationships between different categories or variables. Circle charts are commonly used to show data in a way that is easy to understand and interpret.
Documents:
1
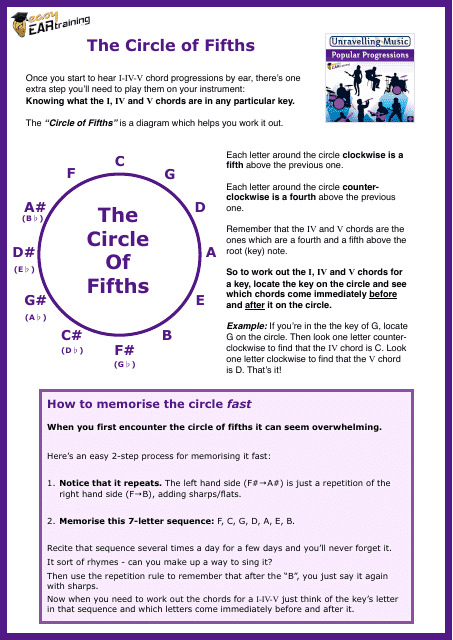
This cheat sheet provides an easy way to practice and memorize the circle of fifths, a useful tool for ear training and understanding music theory.
