Cone Charts
The Cone Chart is a visual representation of the firing temperatures of ceramic glazes and clay bodies. It provides information on the various cone numbers and their corresponding kiln temperatures. This chart is used by ceramic artists and potters to determine the appropriate firing temperature for their clay and glaze materials.
Documents:
1
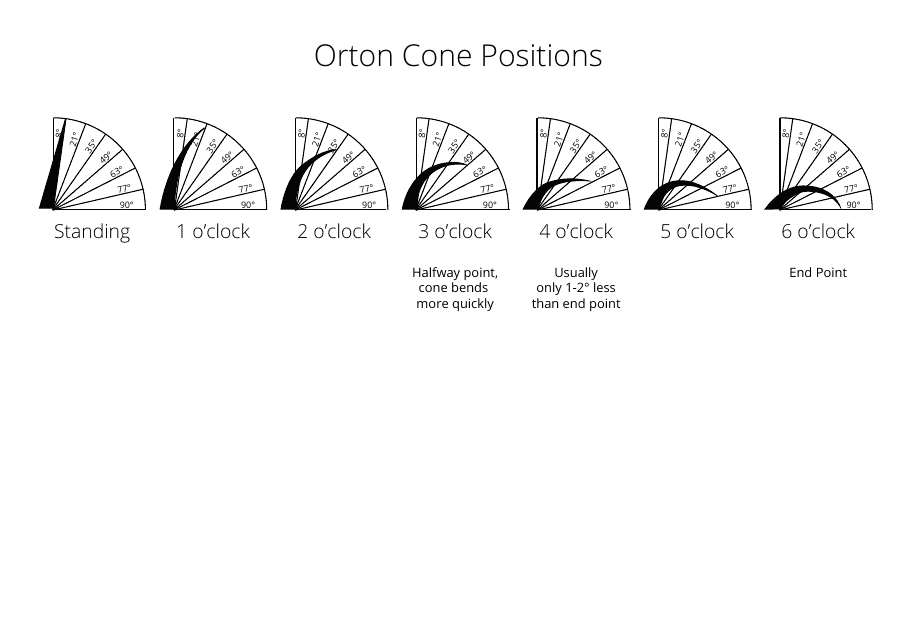
This document provides a chart of the positions of Orton Cones, which are used in pottery and ceramics to monitor and control kiln firing temperatures.
