Temperature Charts
Temperature charts are used to record and track the temperature measurements over a certain period of time. These charts are commonly used in various contexts, such as medical settings to monitor body temperature changes in patients, industrial processes to monitor temperature variations, or weather forecasting to track temperature trends. The specific purpose of a temperature chart may vary depending on the context in which it is used.
Documents:
4
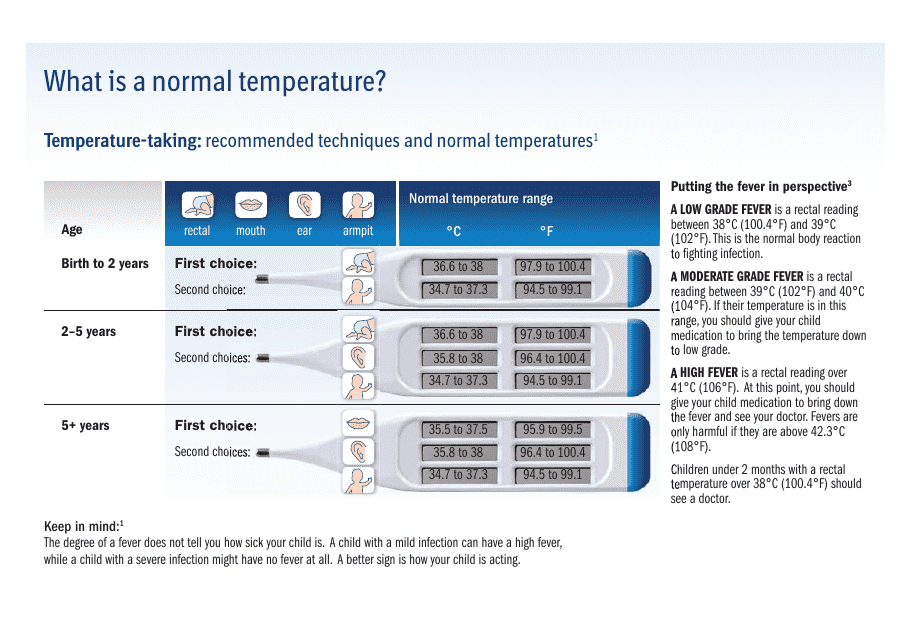
This document provides a fever temperature chart and instructions on how to take your temperature. It helps you keep track of your temperature during an illness and provides guidance on the correct way to measure your body temperature.
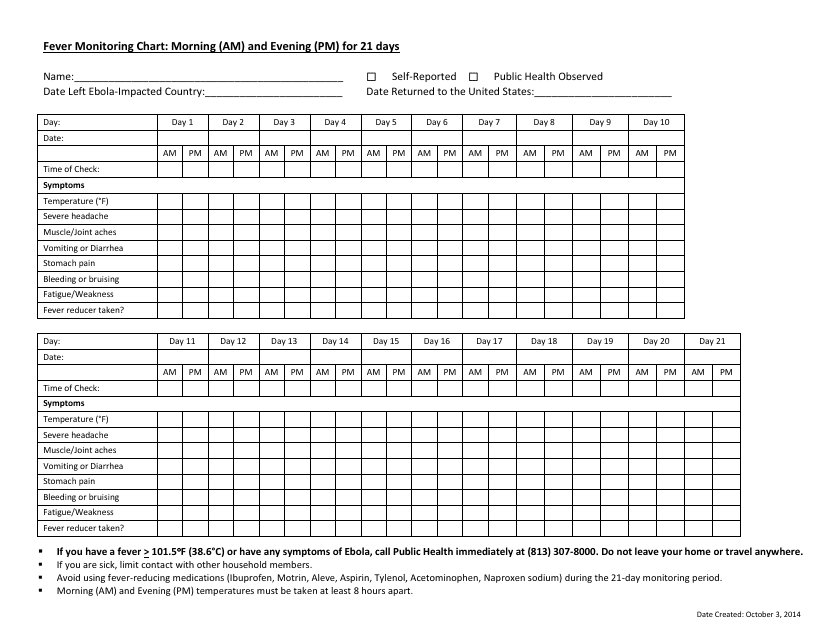
This template is used for tracking and recording fever symptoms in individuals residing in Hillsborough County, Florida. It helps in monitoring fever patterns throughout the day, whether in the morning or evening.
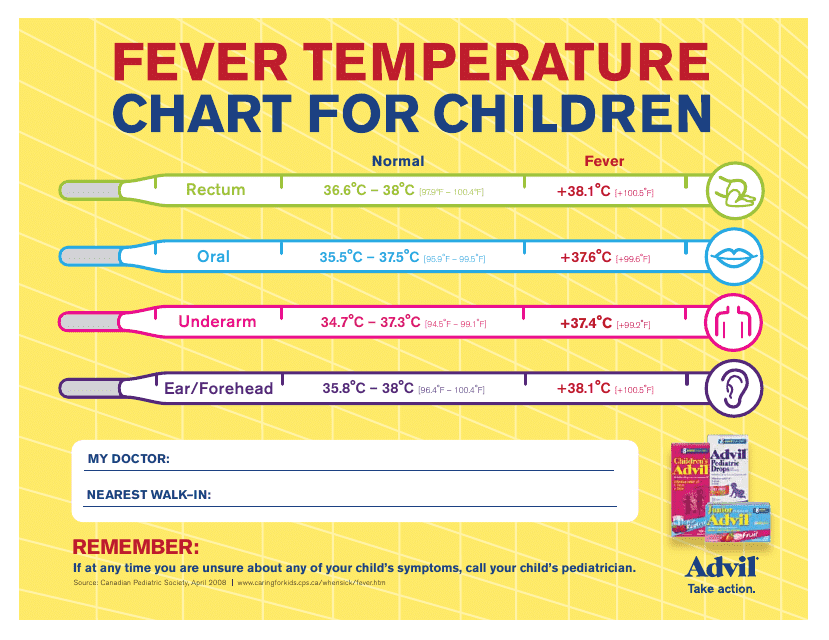
This type of document provides a chart to help parents monitor and track their children's body temperature during a fever. It helps parents determine if their child's temperature is within a normal range or if medical attention is needed.
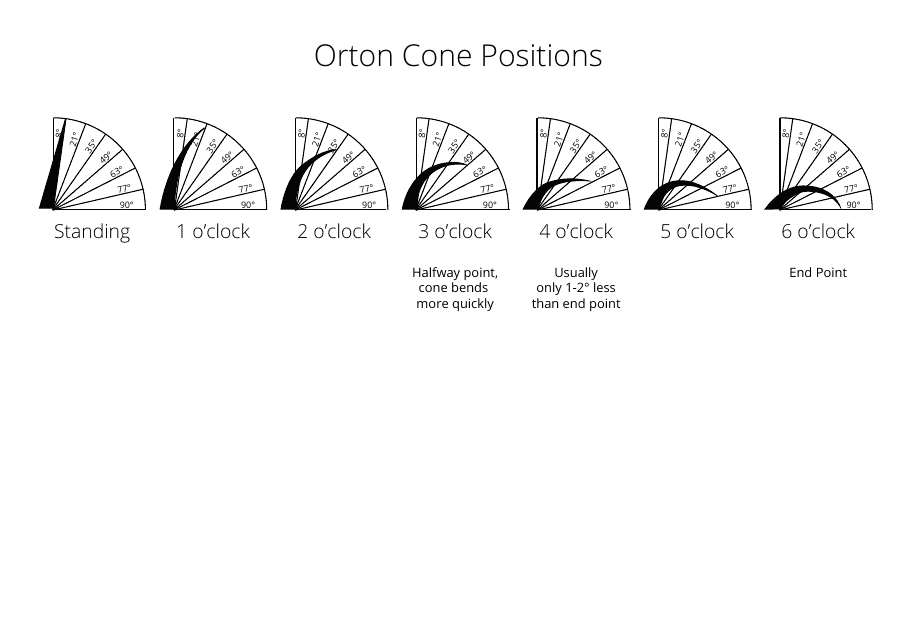
This document provides a chart of the positions of Orton Cones, which are used in pottery and ceramics to monitor and control kiln firing temperatures.
