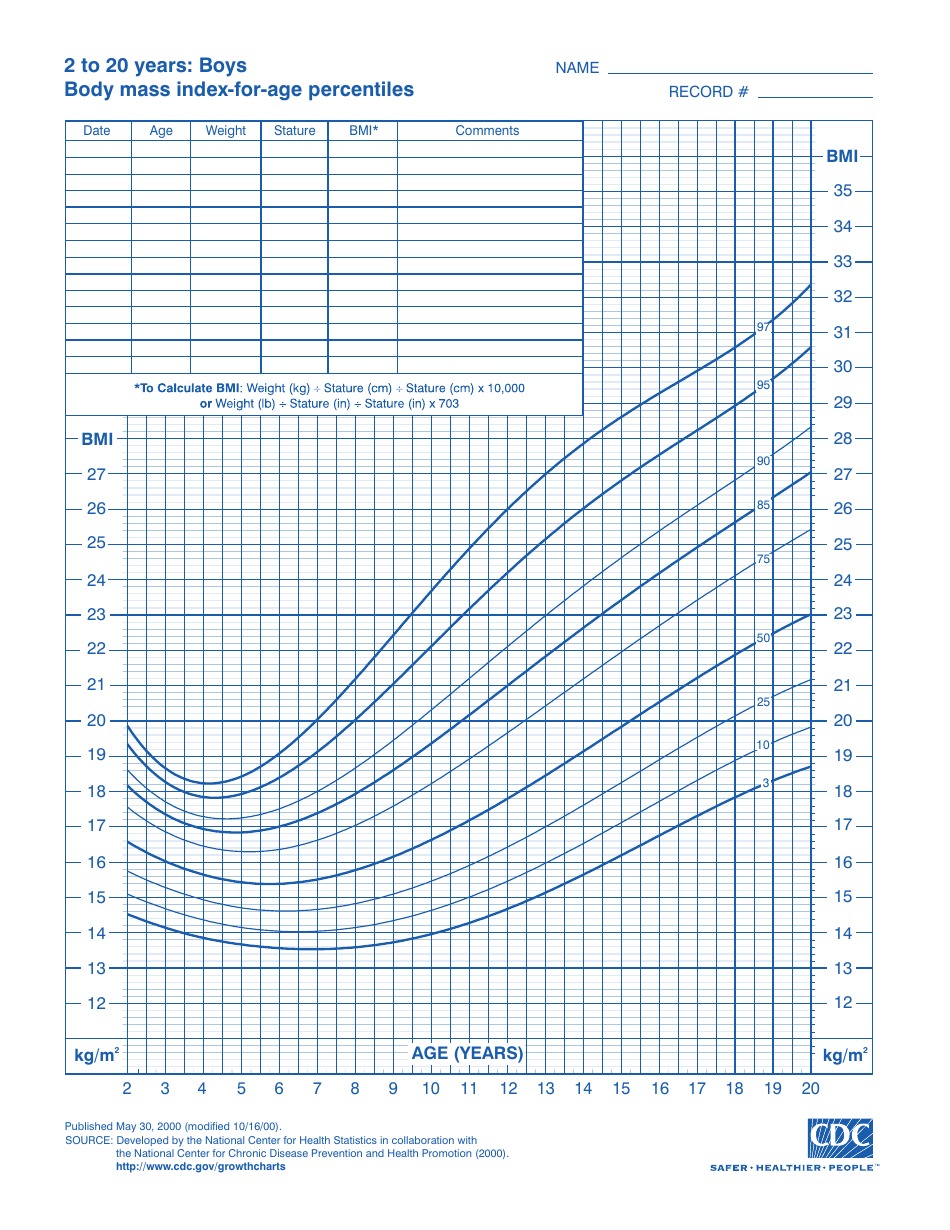
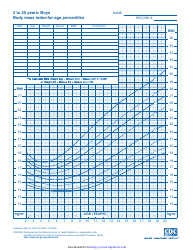
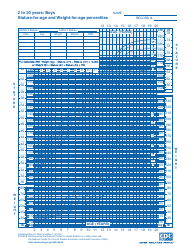
CDC Boys Growth Chart: 2 to 20 Years, Body Mass Index-For-Age Percentiles (3rd - 97th Percentile)
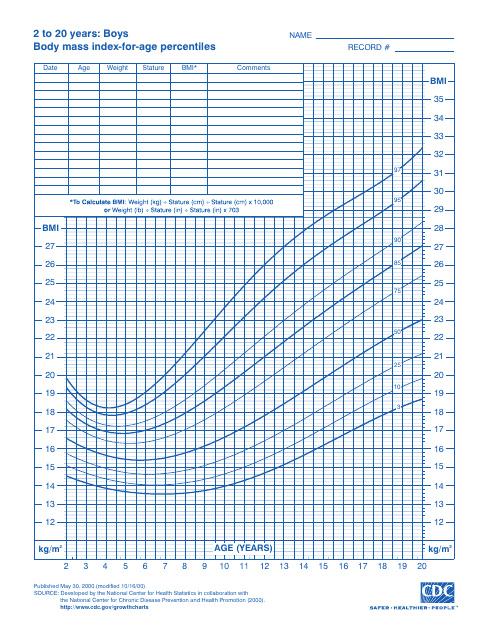
CDC Boys Growth Chart: 2 to 20 Years, Body Mass Index-For-Age Percentiles (3rd - 97th Percentile) is a 1-page legal document that was released by the U.S. Department of Health and Human Services - Centers for Disease Control and Prevention on October 16, 2000 and used nation-wide.
FAQ
Q: What is the CDC Boys Growth Chart?
A: The CDC Boys Growth Chart is a chart that shows the expected growth in height and weight for boys from ages 2 to 20.
Q: What does the chart show?
A: The chart shows the Body Mass Index (BMI) for age percentiles, ranging from the 3rd to the 97th percentile.
Q: What is BMI?
A: BMI stands for Body Mass Index, which is a measure of body fat based on height and weight.
Q: What do the percentiles represent?
A: The percentiles represent how a boy's BMI compares to other boys in the same age group. For example, the 50th percentile means the boy has a BMI that is higher than 50% of boys his age and lower than 50%.
Q: Why is this chart important?
A: This chart is important as it helps to monitor a boy's growth and identify any potential issues with weight or growth.
Q: How can the chart be used?
A: The chart can be used by parents, doctors, and healthcare professionals to track a boy's growth, assess their weight status, and make informed decisions regarding their health.
Q: Is this chart specific to boys only?
A: Yes, this chart is specific to boys only. There is a separate chart for girls.
Form Details:
- The latest edition currently provided by the U.S. Department of Health and Human Services - Centers for Disease Control and Prevention;
- Ready to use and print;
- Easy to customize;
- Compatible with most PDF-viewing applications;
- Fill out the form in our online filing application.
Download a printable version of the form by clicking the link below or browse more legal forms and templates provided by the issuing department.