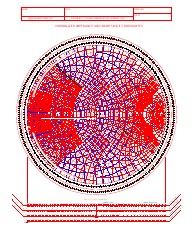
Black and White Smith Chart

The Black and White Smith Chart is used in electrical engineering to analyze and calculate the performance of electrical circuits, particularly in the field of radio frequency (RF) and microwave engineering. It helps in understanding impedance matching, transmission line theory, and other circuit analysis applications.
FAQ
Q: What is a Black and White Smith Chart?
A: A Black and White Smith Chart is a graphical tool used in electrical engineering and RF (radio frequency) design to analyze and represent complex impedance.
Q: How does a Black and White Smith Chart work?
A: A Black and White Smith Chart represents the reflection coefficient or impedance as a point on a polar coordinate system. It provides information about impedance matching, transmission line effects, and stability in RF circuits.
Q: Why is it called Black and White Smith Chart?
A: The term 'Black and White' refers to the colors used in traditional paper-based Smith Charts, where black is used for the resistive part and white for the reactive part of the impedance.
Q: What are the applications of a Black and White Smith Chart?
A: A Black and White Smith Chart is widely used in RF design, antenna theory, impedance matching, and microwave engineering.
Q: Is a Black and White Smith Chart still used today?
A: While paper-based Black and White Smith Charts are less commonly used today due to advancements in computer-based analysis tools, understanding the principles and concepts of a Smith Chart is still important in RF engineering.