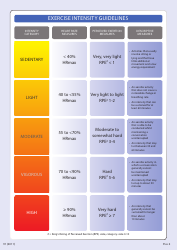
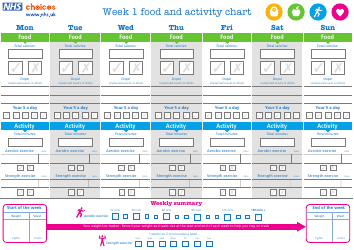
Physical Activity Intensity Chart

The Physical Activity Intensity Chart is a tool that helps individuals determine the level of intensity of different physical activities. It categorizes activities into different intensity levels, such as light, moderate, and vigorous, allowing people to make informed decisions about their fitness routine. It is often used by healthcare professionals, fitness trainers, and individuals seeking to improve their physical health.
FAQ
Q: What is a Physical Activity Intensity Chart?
A: A chart that categorizes different activities based on their intensity level.
Q: Why is a Physical Activity Intensity Chart useful?
A: It helps people understand the level of effort required for various activities.
Q: How is physical activity intensity measured?
A: It is measured in terms of metabolic equivalents (METs), which represent the amount of energy expended during an activity.
Q: What are the different intensity levels in the chart?
A: The chart typically categorizes activities into light, moderate, and vigorous intensity levels.
Q: What are examples of light intensity activities?
A: Light intensity activities include walking, stretching, and household chores.
Q: What are examples of moderate intensity activities?
A: Moderate intensity activities include brisk walking, cycling, and swimming.
Q: What are examples of vigorous intensity activities?
A: Vigorous intensity activities include running, fast cycling, and high-intensity aerobic exercises.
Q: Is there a specific time duration recommended for each intensity level?
A: Yes, the recommended time duration for each intensity level may vary, but in general, at least 150 minutes of moderate intensity activity or 75 minutes of vigorous intensity activity per week is recommended for adults.
Q: Can I mix different intensity levels of activities?
A: Yes, it is beneficial to combine different intensity levels of activities to achieve a well-rounded fitness routine.