A1c Test Levels Chart - Uw Health

The A1c Test Levels Chart is used to measure and monitor the average blood sugar levels over a period of time for individuals with diabetes. It helps guide healthcare providers in assessing the management of diabetes and making treatment decisions.
FAQ
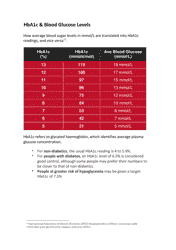
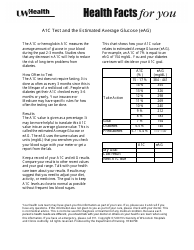
Q: What is an A1c test?
A: The A1c test measures the average blood sugar level over the past 3 months.
Q: How often should an A1c test be done?
A: It is recommended to have an A1c test done at least twice a year for people with diabetes.
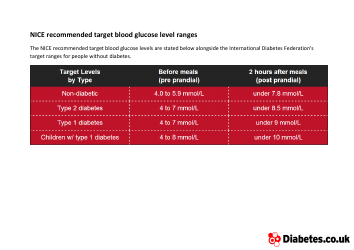
Q: What is a normal A1c level?
A: A normal A1c level for a person without diabetes is below 5.7%.
Q: What is a good A1c level for people with diabetes?
A: A good A1c level for individuals with diabetes is usually below 7%. However, the target may vary based on individual circumstances.
Q: What does a high A1c level indicate?
A: A high A1c level indicates poor blood sugar control and may suggest a risk for complications related to diabetes.
Q: What does a low A1c level indicate?
A: A low A1c level may indicate hypoglycemia, a condition characterized by low blood sugar levels.
Q: How can I lower my A1c level?
A: Managing a healthy diet, regular exercise, and taking medications as prescribed can help lower A1c levels.
Q: What factors can affect A1c levels?
A: Factors such as diet, exercise, stress, illness, and certain medications can affect A1c levels.
Q: Is the A1c test the same as a blood sugar test?
A: No, the A1c test provides information about average blood sugar levels over time, while a blood sugar test measures current blood sugar levels.