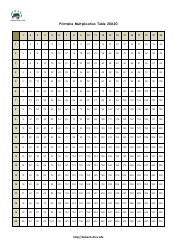
20 X 40 Times Table Chart

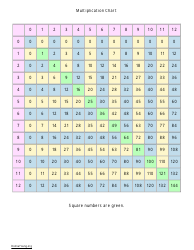
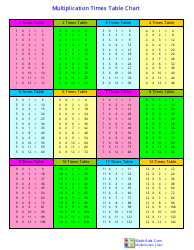
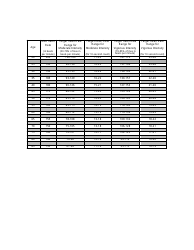
A 20 x 40 times table chart is a tool used for learning and practicing multiplication. It displays the multiplication results for numbers ranging from 1 to 20 and 1 to 40. This chart can help students understand and memorize the multiplication facts for these numbers. It is commonly used in schools and math education to enhance mathematical skills and speed in multiplication calculations. The chart allows students to quickly find the product when multiplying any two numbers within the specified range.
The 20 x 40 times table chart is typically filed by educational institutions, such as schools and educational publishing companies. It is often used as a resource for teaching mathematics and can be found in textbooks or educational materials.
FAQ
Q: What is a 20 x 40 times table chart?
A: A 20 x 40 times table chart is a visual representation of the multiplication table for numbers from 1 to 20 multiplied by numbers from 1 to 40.
Q: How can I use a 20 x 40 times table chart?
A: You can use a 20 x 40 times table chart to quickly find the product of any number from 1 to 20 multiplied by any number from 1 to 40.
Q: Why might someone need a 20 x 40 times table chart?
A: Someone might need a 20 x 40 times table chart if they frequently need to perform calculations involving numbers in that range and find it helpful to have a visual reference.
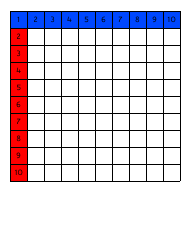
Q: Can I create my own 20 x 40 times table chart?
A: Yes, you can create your own 20 x 40 times table chart using a spreadsheet software, such as Microsoft Excel or Google Sheets. Simply input the numbers from 1 to 20 in the rows and the numbers from 1 to 40 in the columns, and fill in the products for each combination of numbers.