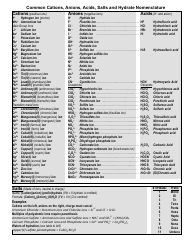
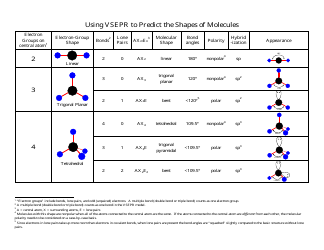
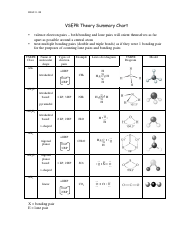
Vsepr Theory (Molecular Shapes) Chart
 Chart - Document preview and visual display of different molecular shapes based on Vsepr Theory. Explore the chart to understand the geometry and bonding arrangements of different molecules.")
What Is a VSEPR Chart?
A VSEPR Chart (or "VSEPR Model") is a handy tool to use both in the classroom and when studying at home. The chart is widely known for helping students in understanding molecular geometry and is generally used during freshman-level Chemistry lessons. VSEPR is short for "Valence Shell Electron Pair Repulsion," a chemical theory originally developed by R. Gillespie and R. Nyholm for forecasting the shapes of molecules based on the amount of electron pairs circling a central atom. A VSEPR Chart PDF version can be downloaded through the link below.
Alternate Name:
- Molecular Shape Chart.
Knowing the geometry of molecules is vital to understanding its reactions. VESPR provides a simple method of predicting the geometries of main group compounds. The theory is applied when predicting the combinations of electron doubles around atoms in simple and symmetric molecules. In them, central atoms attach to two or more other atoms. The shapes of these key atoms and the non-bonding electron doubles influence the shape of the larger whole.
How to Use a VSEPR Chart?
Using a Molecular Shape Chart helps to identify the connection between the number of places where valence electrons are situated and to understand the electron geometry around an atom.
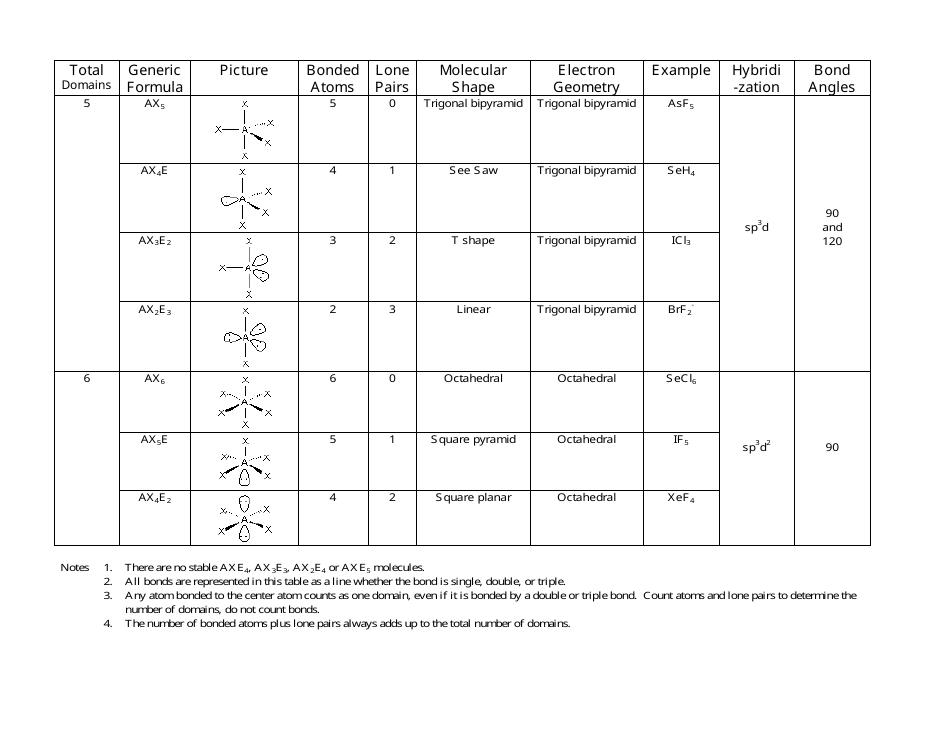
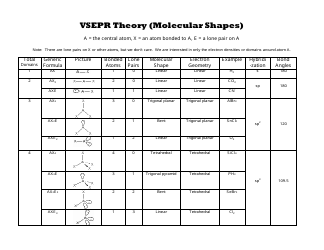
A VSEPR Shape Chart consists of columns and rows. The description of the columns and their usage is as follows:
- Total domains . This column contains numbers from 1 to 6 (also called "numbers of electron domains" or "steric numbers"). The steric number is usually indicated as SN. To calculate this number, you should sum up X and E that atom A has in a molecule. Electron domains include bonded atoms, lone pairs of electrons, and unpaired electrons. You should consider multiple connections as one electron domain.
- A generic formula . It reflects the electron pairs circling a central atom. The basic formula is AxnEm, where A is the central atom, X denotes atoms circling A, and E denotes lone pairs of electrons on the A (central atom).
- A picture of electron-group shape represents the appearance of the molecule.
- Bonded atoms . This column contains the amount of connected atoms. To calculate this number, you should summarize all the X in the generic formula.
- Lone pairs . This column represents the amount of lone pairs, which is a place with non-bonding electrons. To calculate this number, you should summarize all the E in the generic formula.
- Molecular shape .
- Electron geometry . This column contains the general molecular shape and other parameters, such as lengths and angles of bonds that demonstrate the location of each atom.
- An example of the compound.
- Hybridization . This column contains hybridization. If you may determine the angles between hybrid orbitals, it will help to explain to you a molecule shape, because these angles are nearly equal to the angles between bonds. There are several types of hybridization: sp, sp2, sp3.
- Bond angles . A bond angle is a theoretical angle between two adjoining bonds. It differs depending on the shape of the molecule.
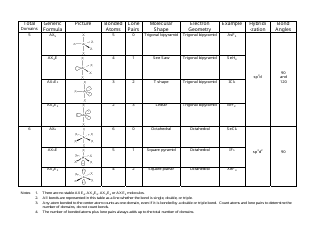
How to Memorize a VSEPR Chart?
To memorize a VSEPR Theory Chart, you should understand how to determine the basic and secondary shapes. The basic shapes are also known as electron geometries. These shapes depend on the SN of the central atom. Remember which number corresponds to which basic shape:
- 2 - to linear;
- 3 - to trigonal planar;
- 4 - to tetrahedral;
- 5 - to trigonal bipyramidal;
- 6 - to octahedral.
The secondary shapes, also known as molecular shapes, appear when both atoms and lone pairs are on the central atom. In this case, the number, corresponding to possible shape, should be calculated as SN−1.
Not what you were looking for? Check out these related documents:
Download Vsepr Theory (Molecular Shapes) Chart
1
2
 Chart - Document preview and visual display of different molecular shapes based on Vsepr Theory. Explore the chart to understand the geometry and bonding arrangements of different molecules.")