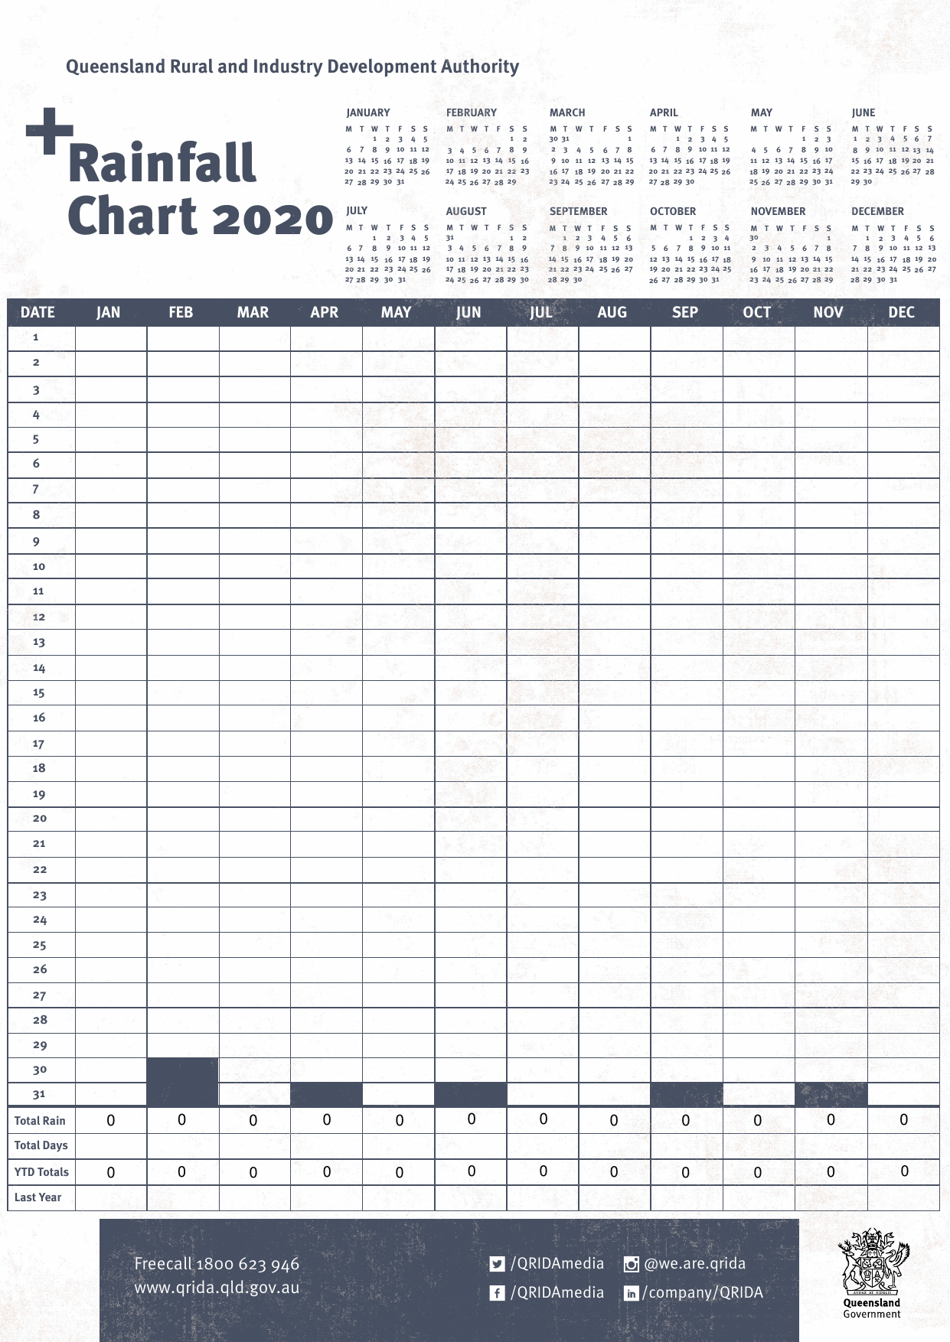
Rainfall Chart - Queensland, Australia
The Rainfall Chart for Queensland, Australia is used to track and analyze the amount of rainfall in different regions of Queensland over a specific period of time. It helps in understanding the rainfall patterns and can be used for various purposes such as agriculture, water management, and weather forecasting.
The Bureau of Meteorology in Queensland, Australia files the rainfall chart.
FAQ
Q: What is the average rainfall in Queensland, Australia?
A: The average rainfall in Queensland, Australia varies across the region.
Q: Which areas in Queensland receive the highest rainfall?
A: The areas in North Queensland generally receive the highest rainfall.
Q: Which areas in Queensland receive the lowest rainfall?
A: The areas in Western Queensland generally receive the lowest rainfall.
Q: What is the wettest season in Queensland, Australia?
A: The wettest season in Queensland, Australia is typically the summer season.
Q: What is the driest season in Queensland, Australia?
A: The driest season in Queensland, Australia is typically the winter season.
Q: Does Queensland experience tropical cyclones?
A: Yes, Queensland experiences tropical cyclones, particularly in the northern regions.
Q: Which months are most prone to cyclones in Queensland?
A: Cyclones in Queensland are most prone to occur between November and April.
Q: How does rainfall vary between coastal and inland areas of Queensland?
A: Generally, coastal areas of Queensland receive higher rainfall compared to inland areas.
Q: Are there any significant rainfall variations within Queensland?
A: Yes, there can be significant rainfall variations within different regions of Queensland.
Q: Why is rainfall important in Queensland?
A: Rainfall is important in Queensland for sustaining agriculture, water supply, and ecosystem health.