Break-Even Analysis Template

What Is a Break-Even Analysis?
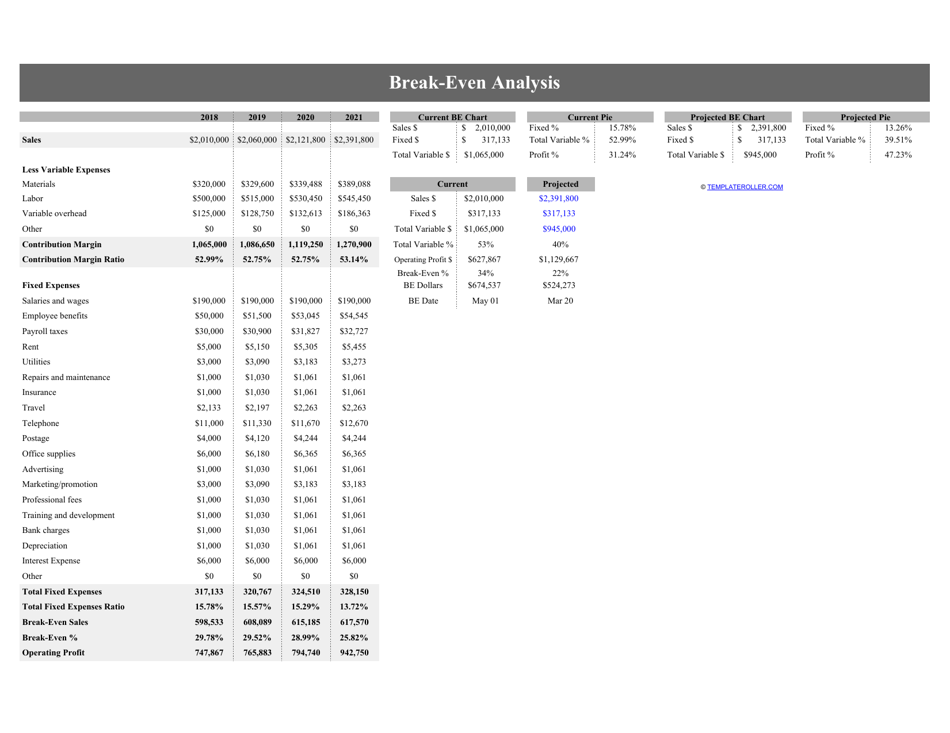
A Break-Even Analysis is an analytical tool that allows an entity to determine at what point its business may reimburse all of the investments made in this project, and the subsequent income that can be called profit. This point is called the break-even point, break-even threshold, or profitability threshold. When this point is reached, the enterprise or investment project has no profit and no losses. Even before the start of investment activity, it is necessary to determine the volume of products to sell or the volume of services to provide to compensate for current costs.
A comprehensive Break-Even Analysis entails getting a dynamic view of the correlation between its sales, costs, and profits. This analysis also helps to understand the feasibility of increasing production volumes, calculate and schedule a sales plan, determine the number of product units that must be sold to work without losses, and evaluate how changes in prices, costs, and sales volumes affect the company's revenue. A Break-Even Analysis template available in Excel can be downloaded through the link below.
How to Do a Break-Even Analysis?
In order to use the Break-Even Analysis formula, you must correctly divide all of the costs of the current period into fixed and variable costs. Fixed costs are those costs that do not depend on and do not change with changes in production and sales volumes. These costs include property and real estate taxes, depreciation charges for a linear method of accrual, rental and security payments, accounting and insurance expenses, utility costs, and wages of administrative personnel.
Variable costs are those costs that change as production and sales volumes change. These costs include the cost of raw materials and component materials, energy and fuel costs, wages of workers engaged in the production process, including accruals and commission fees.
The break-even threshold can be defined in units of production, in monetary terms, or based on the expected amount of profit. To determine the break-even threshold in units of production or natural terms, you should take the following steps:
- Determine the margin profit per unit of production. For this purpose, subtract the average variable costs from the unit sale price.
- To obtain the value of the desired point, you need to divide total fixed costs by marginal profit per unit of production.
To determine the break-even threshold in monetary terms, you should make the following calculations:
- Calculate the entire costs, which is the sum of variable and fixed costs necessary for a specific volume of output.
- Determine the gross revenue amount, which is equivalent to the sum of the total costs. It is required to know that the gross revenue is equal to the product of price and sales volume.
- To calculate gross margin profit, subtract the sum of variable costs from the gross revenue amount.
- To obtain the value of the desired point, you need to multiply gross revenue by total fixed costs and divide the received value by gross margin profit.
Based on the obtained calculations, it is necessary to build a linear or non-linear Break-Even Analysis graph that displays the obtained results.
Haven't found the template you're looking for? Take a look at the related templates below: