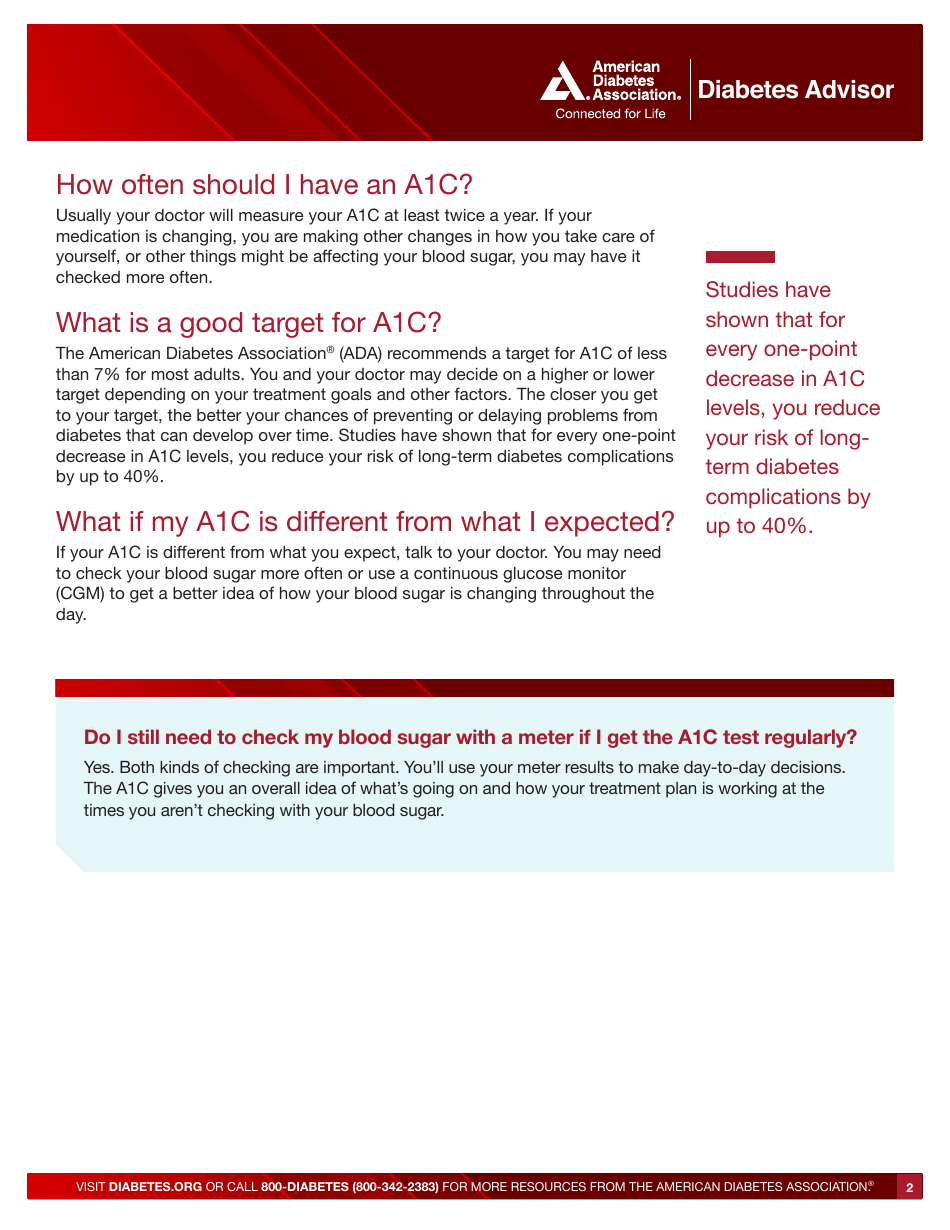
A1c / Eag Conversion Chart

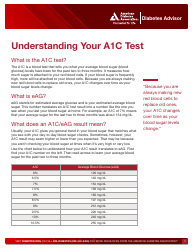
The A1c/Eag Conversion Chart is used to convert A1c levels, which measure average blood sugar levels over a few months, into estimated average glucose (eAG) values. This helps individuals understand their overall blood sugar control.
The A1c/EAG conversion chart is not filed by any specific entity. It is a reference tool used by healthcare professionals to interpret A1c and estimated average glucose (EAG) values.
FAQ
Q: What is an A1c/EAG conversion chart?
A: An A1c/EAG conversion chart is a tool used to convert blood glucose levels measured in different units.
Q: Why is an A1c/EAG conversion chart used?
A: An A1c/EAG conversion chart is used to help people understand and compare their blood glucose levels, as different units can be used in different countries or healthcare settings.
Q: How does an A1c/EAG conversion chart work?
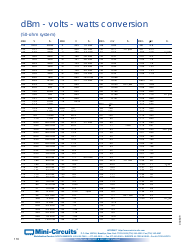
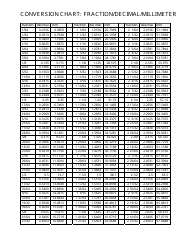
A: An A1c/EAG conversion chart provides a conversion factor to convert blood glucose levels measured in milligrams per deciliter (mg/dL) to millimoles per liter (mmol/L), or vice versa.
Q: What are A1c and EAG?
A: A1c is a blood test that measures average blood glucose levels over the past 2-3 months, while EAG (Estimated Average Glucose) is an estimation of average blood glucose levels based on A1c results.
Q: Why are A1c and EAG important?
A: A1c and EAG are important in managing diabetes, as they provide information about long-term blood glucose control and can help guide treatment decisions.
Download A1c / Eag Conversion Chart
1

2