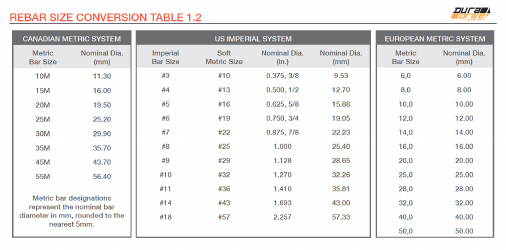
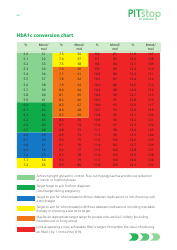
Hba1c Conversion Chart

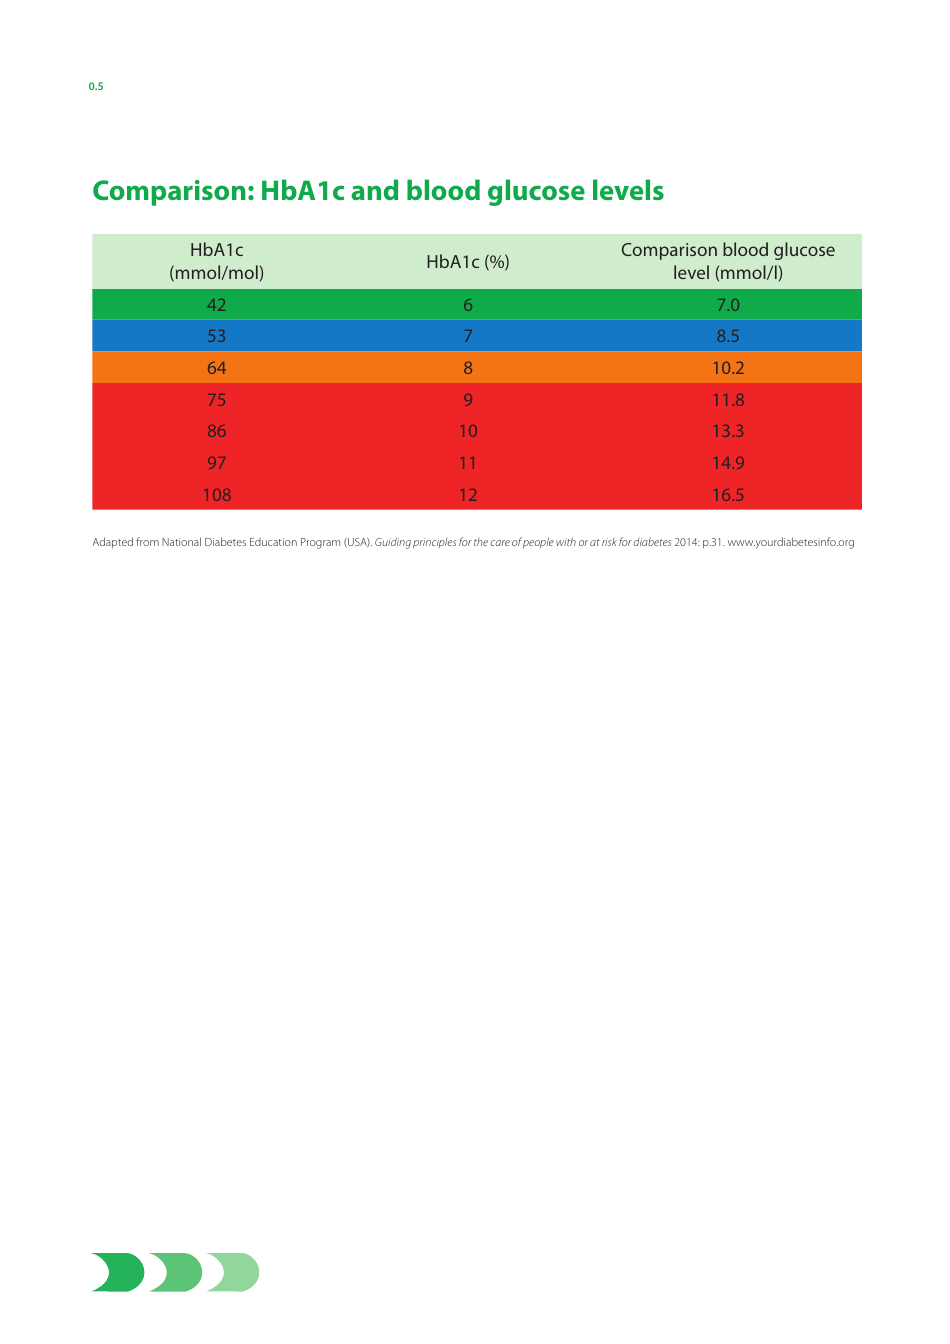
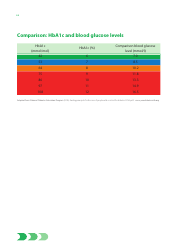
An HbA1c conversion chart is used to determine the estimated average blood sugar levels over a specific time period. It helps healthcare professionals and individuals with diabetes to assess and manage their diabetes control. It provides information on the correlation between HbA1c values and average blood glucose levels.
The HbA1c conversion chart is not filed by any specific entity. It is often available online or provided by healthcare professionals to help convert HbA1c levels between different measurement systems (e.g., percentage to mmol/mol).
FAQ
Q: What is an HbA1c conversion chart?
A: An HbA1c conversion chart is a tool used to convert HbA1c levels, which measure average blood sugar levels over a few months, into estimated average blood glucose levels.
Q: How does an HbA1c conversion chart work?
A: An HbA1c conversion chart uses a mathematical formula to estimate average blood glucose levels based on the HbA1c measurement.
Q: Why is an HbA1c conversion chart useful?
A: An HbA1c conversion chart can help individuals with diabetes understand their blood sugar control and make adjustments to their treatment plan.
Q: Are HbA1c conversion charts accurate?
A: HbA1c conversion charts provide an estimated average blood glucose level and may not be exact for everyone, but they serve as a useful guide for monitoring diabetes control.
Download Hba1c Conversion Chart
1
2