Body Mass Index Chart - Move!

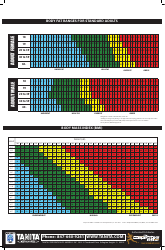
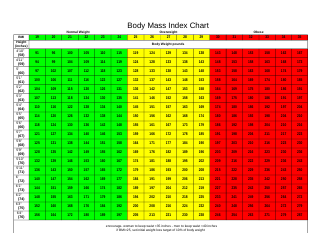
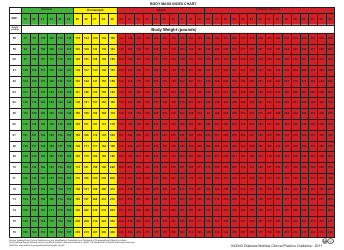
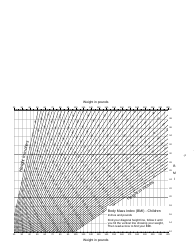
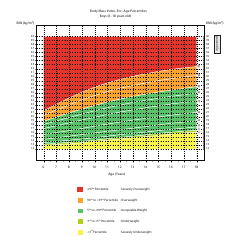
The Body Mass Index (BMI) Chart - Move! is a tool used to assess a person's body weight in relation to their height. It helps determine if a person is underweight, normal weight, overweight, or obese. It is often used as a guide to promote healthy weight management and overall well-being.
FAQ
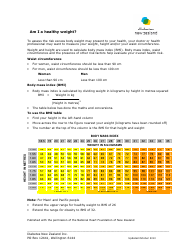
Q: What is a Body Mass Index (BMI) chart?
A: A Body Mass Index (BMI) chart is a tool used to assess a person's weight and determine if they fall into a healthy weight range.
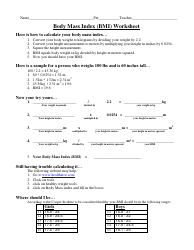
Q: How is BMI calculated?
A: BMI is calculated by dividing a person's weight in kilograms by the square of their height in meters.
Q: What does a BMI of less than 18.5 indicate?
A: A BMI less than 18.5 indicates that a person may be underweight.
Q: What does a BMI of 18.5 to 24.9 indicate?
A: A BMI between 18.5 and 24.9 indicates that a person is within a healthy weight range.
Q: What does a BMI of 25 to 29.9 indicate?
A: A BMI between 25 and 29.9 indicates that a person may be overweight.
Q: What does a BMI of 30 or higher indicate?
A: A BMI of 30 or higher indicates that a person may have obesity.
Q: Are there limitations to using BMI?
A: Yes, BMI is a general tool and does not take into account factors such as muscle mass, bone density, and distribution of fat.
Q: Should I solely rely on BMI to assess my health?
A: No, BMI should be used in conjunction with other health indicators such as waist circumference, blood pressure, and cholesterol levels.