Free BMI Chart Templates
What Is a BMI Chart?
A BMI Chart helps determine whether the weight of an individual is within the healthy range by using the height and weight of the individual. By using a formula, a value will be produced and this value will be placed into one of the categories which will clearly detail just how healthy an individual is. The produced value can be compared against any BMI Charts which will provide information about how healthy an individual is.
Alternate Name:
- BMI Classification Chart.
When determining if an individual has a normal weight, a medical practitioner may consider additional criteria in addition to the BMI. For example, individuals such as weightlifters or heavy athletes could be incredibly muscular and still maintain a good weight despite BMI levels appearing to be extremely high, suggesting excess weight but the reality is different since muscles are much heavier compared to fat tissue.
However, the majority of BMI Charts available are not specific to gender i.e. there is no separate male BMI Chart and female BMI Chart. It is common to find a BMI Chart for kids because they develop differently and have different norms, but it is rare to find a chart that takes into account gender. Nonetheless, this is important and now more and more gender-specific charts are being produced where males have a slightly higher BMI limit than women.
For a full list of BMI Chart templates please feel free to check out our library below.
BMI Chart Types
- A Child BMI Chart would be extremely useful in determining the body mass index of a child and also helps ensure that a child reaches or maintains a healthy weight which can be accomplished by monitoring development. There are a variety of charts available, some of them calculating BMI from 2 years old, others from 5 years old;
- An Adult BMI Chart is a trustworthy measure of adult body fat and is required to assess the various categories that could cause health issues. The results of this will often be a wakeup call for those individuals that have poor health and will allow them to make any necessary changes to their diet and/or lifestyle.
How to Read a BMI Chart?
Reading a BMI Chart is quick and easy to understand. However, before looking at the BMI Chart you need to make sure that you have the most up-to-date measurements available on hand which takes into account the weight of an individual (in kg) as well as the height (in m).
Once these two parameters are on hand, they can be used to calculate the BMI by simply dividing the weight by height2 and this will produce a number. That number is extremely important because that is the number you use to read the BMI chart. The value of this number can fall into one of four categories which are described below:
- If the gained value is less than 18.5 the individual is considered to weigh too little and in some instances, this can be a cause for concern so should not be ignored . There are specific diseases and risks associated with poor weight some of which can result in death;
- The best range is above 18.5 but below 25 and this is considered the absolute optimal weight . If your value falls under this, the likelihood is that you are living a healthier lifestyle but this does not mean that you should check it once and forget about it. Regular checks and calculations are required, particularly if you are on the border of being overweight;
- Any values above 25 but below 30 indicate that the individual in question has excess weight and this is not considered healthy . Steps should be taken to return to the optimal weight range as prolonged excessive weight can have some serious health implications, some of which will not be reversible;
- Any individual with a BMI of 30 or greater is considered obese and this opens up a whole bucket of additional and extremely serious health issues, most of which will inevitably lead to death . Immediate steps should be taken to lose weight and adopt the lifestyle of the individual for a better quality of life.
Haven't found the template you're looking for? Take a look at the related templates below:
Documents:
13
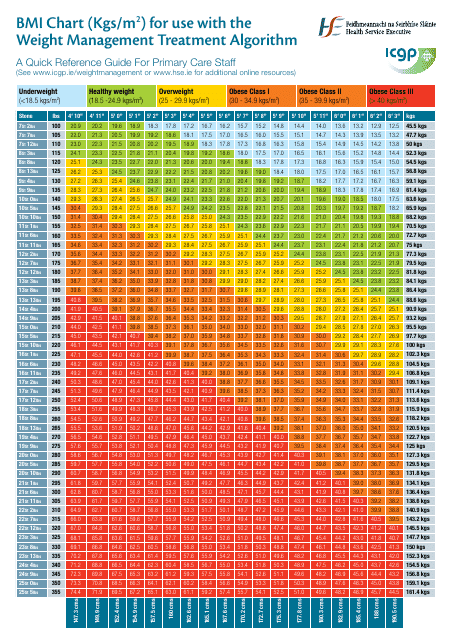
This document provides a BMI chart for use with the Weight Management Treatment Algorithm developed by ICGP (International Concussion Guidelines Panel). It helps healthcare professionals determine a patient's body mass index (BMI) and assists in their weight management treatment plan.
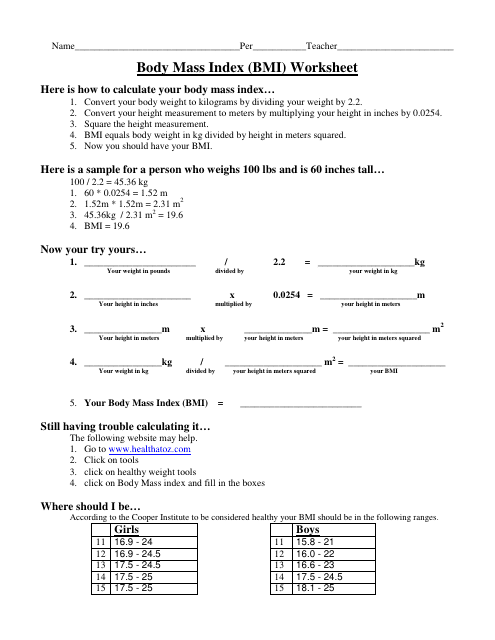
This document is a worksheet to calculate your Body Mass Index (BMI).

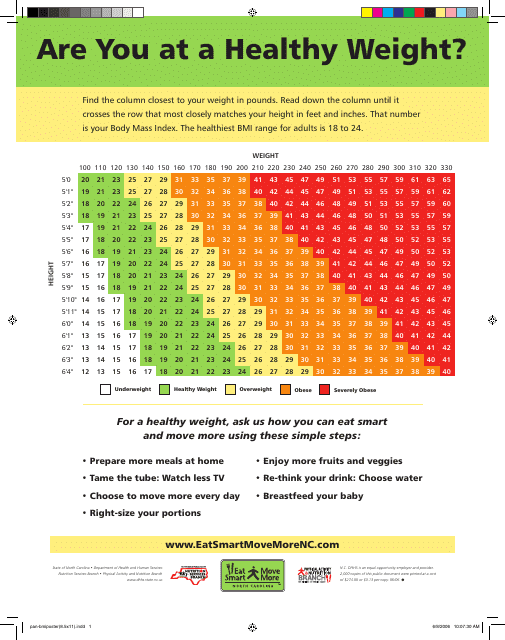
This document provides a chart that helps adults determine their Body Mass Index (BMI) based on their height and weight. BMI is a measure of body fatness and can indicate whether a person is underweight, normal weight, overweight, or obese. Use this chart to assess your BMI and understand its implications for your health.
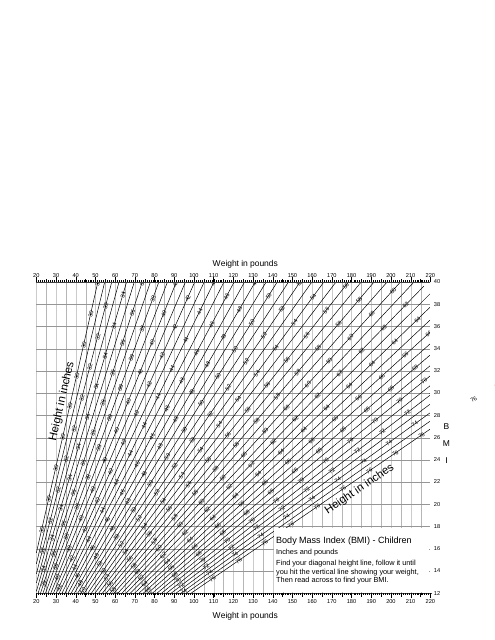
This document provides a Body Mass Index (BMI) chart specifically designed for children. It helps parents and healthcare professionals assess a child's weight status based on their age and height.
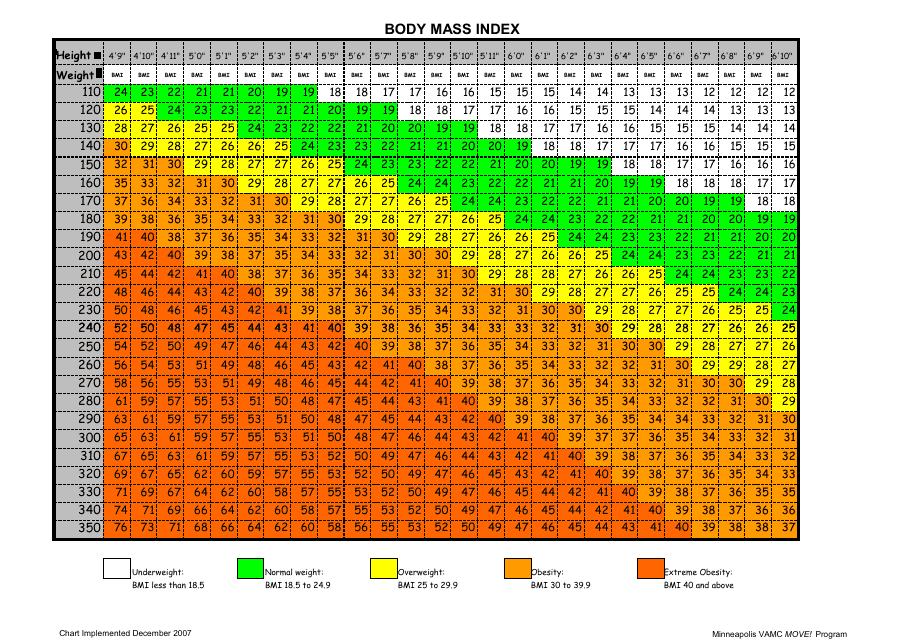
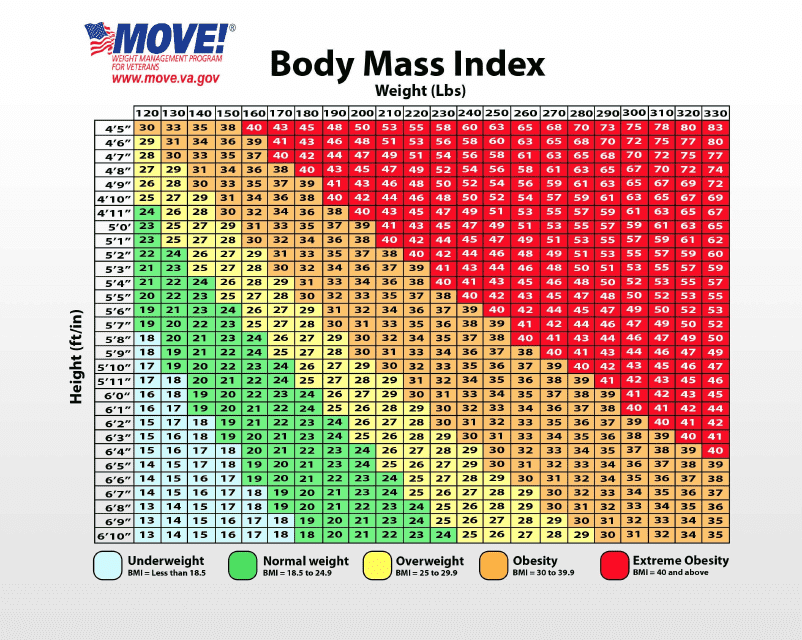
This form is used as a Body Mass Index (BMI) chart for participants in the Minneapolis VAMC Move! Program.
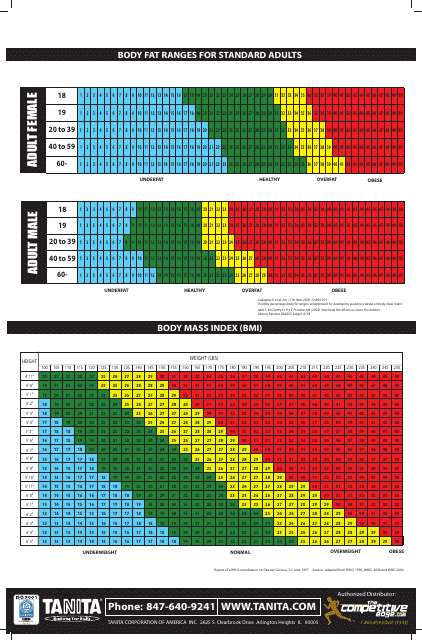
This document provides body fat ranges for standard adults, as well as information on Body Mass Index (BMI) and body fat ranges for children. It is a helpful resource for understanding and tracking body composition.
This BMI chart is used to calculate the Body Mass Index (BMI) for adults. It helps determine if a person's weight is within a healthy range based on their height.
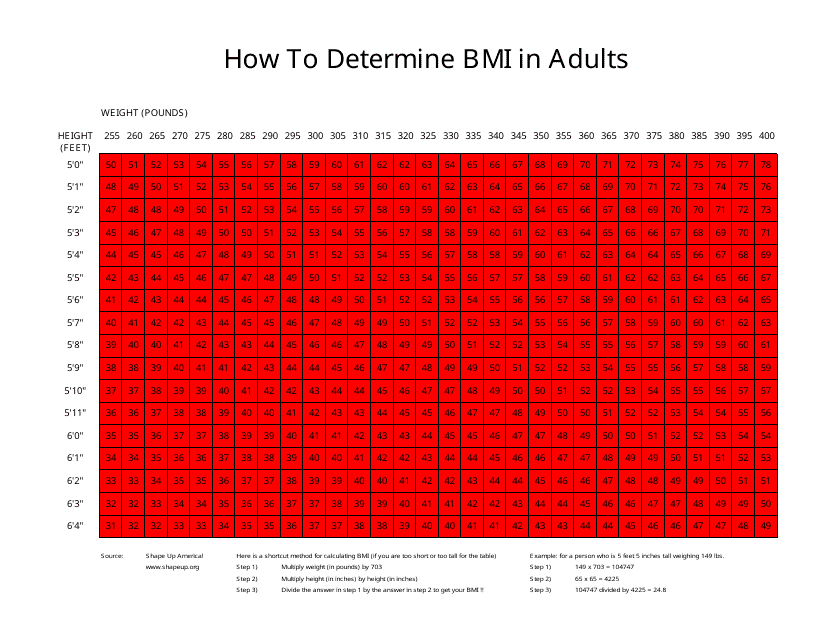
This document provides a chart to help adults determine their Body Mass Index (BMI), which is a measurement of body fat based on height and weight. It helps individuals understand if their weight falls within a healthy range or if they are underweight, overweight, or obese.
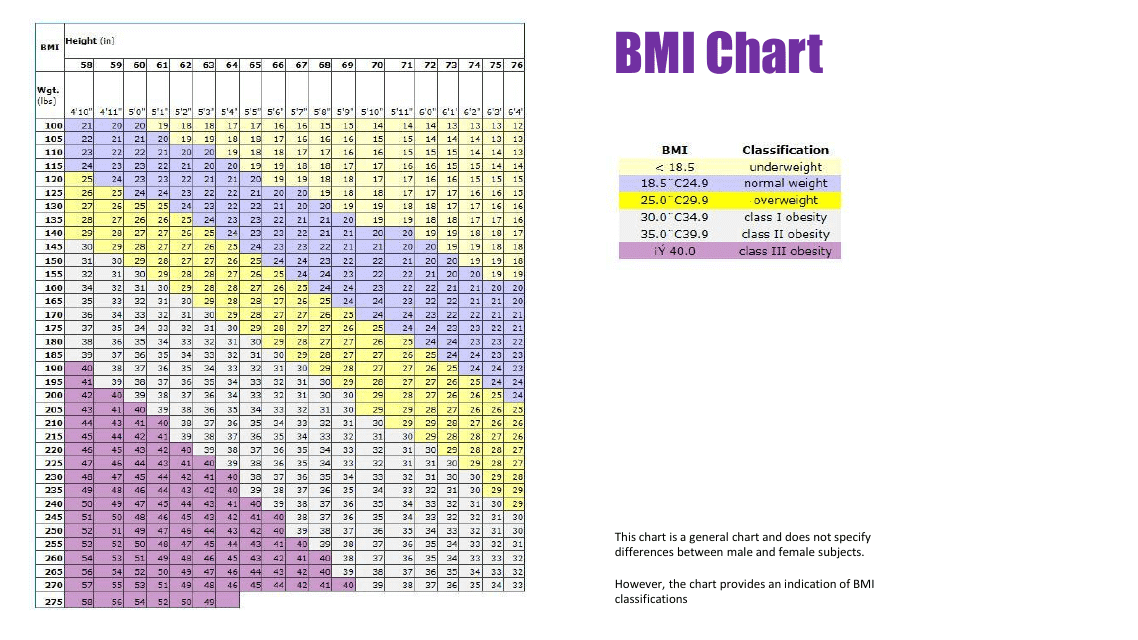
This document provides a general BMI (Body Mass Index) chart used to determine if a person is underweight, normal weight, overweight, or obese based on their height and weight.
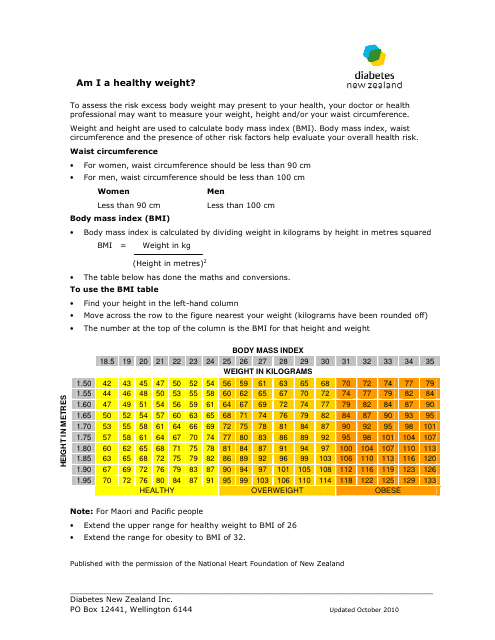
This document provides a Body Mass Index (BMI) chart for individuals in New Zealand. It is useful for monitoring weight and determining if a person is at a healthy or overweight level.
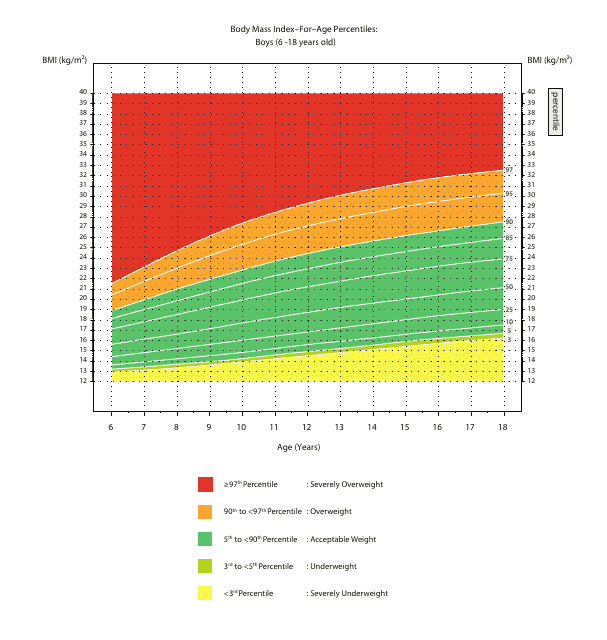
This chart shows the Body Mass Index (BMI) percentiles for boys aged 6 to 18 years old. It is used to track a child's weight status and determine if they fall within a healthy range for their age.
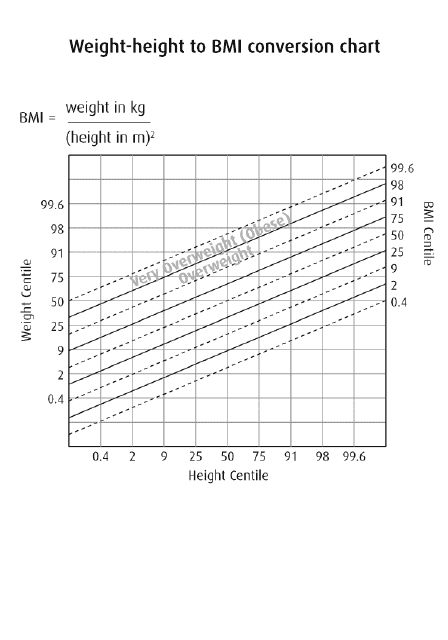
This document provides a chart that helps convert weight and height measurements into Body Mass Index (BMI) values. The BMI is a measure of body fat based on a person's weight and height.
This chart helps you track your body mass index (BMI) to determine if you are at a healthy weight.
