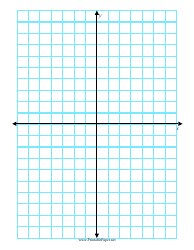
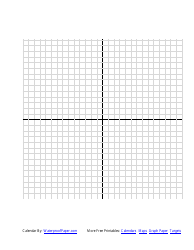
Lined Graph Paper X Y and Z Axis

Lined Graph Paper with X, Y, and Z Axis is typically used for various mathematical and physics purposes. It's especially useful for those who study advanced mathematic subjects and physics that involve not just two dimensions, but three. The X, Y, and Z axes refer to the three dimensions in a three-dimensional space.
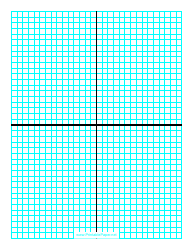
It often used in graphing three-dimensional equations or mapping physical phenomena in three dimensions. For instance, engineers may use it in plotting 3D structure designs, mathematicians might use it to graph equations, and students use it to understand the concepts of depth and space in mathematics and physics studies.
This type of paper allows for the expanded plotting of functions, providing a more detailed visual interpretation of mathematical and physics principles. It helps to visualize data and understand the structure and dependence in a tridimensional level.
The lined graph paper X, Y, and Z axis is typically filed by students, researchers, scientists, mathematicians, and engineers. These individuals frequently use such graph papers for various purposes including graphing mathematical equations, data visualization, drawing models and diagrams, etc. It's a tool frequently used in academic and professional settings rather than a document filed in a specific country’s official bureau or system. It's not country-specific and is used by individuals globally.
FAQ
Q: What is lined graph paper with x, y, and z axis?
A: Lined graph paper with x, y, and z axis refers to a three-dimensional graph paper which is used primarily in disciplines such as mathematics, engineering, or architecture. It comprises of vertical lines (x-axis), horizontal lines (y-axis), and lines depth-wise (z-axis). It's used to plot three-dimensional figures or for determining the relationship between three different variables.
Q: For what purposes can I use a graph paper with x, y, and z axis?
A: Graph paper with x, y, and z axis is majorly used in fields such as mathematics, architecture, and engineering to create three-dimensional figures. This can be helpful in visualizing complex data sets, representing 3D geometric objects or showing changes in physical properties like temperature or pressure over time.
Q: Is graph paper with x, y, and z axis helpful in learning?
A: Absolutely, graph paper with x, y, and z axis can be a helpful learning tool particularly in fields like mathematics or physics. It provides a visual understanding of complex problems or equations. For instance, it can help visualize cubic functions, 3D geometric objects or examine the correlation between three different variables.