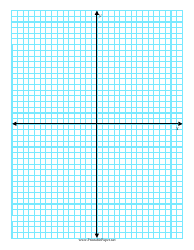
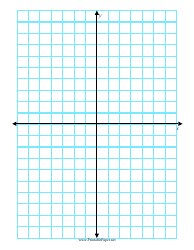
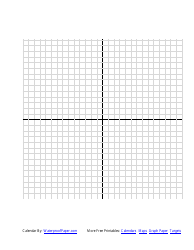
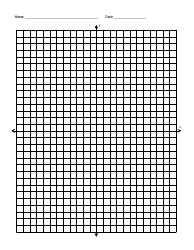
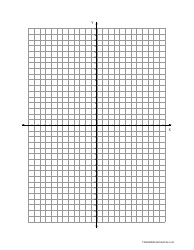
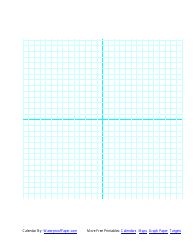
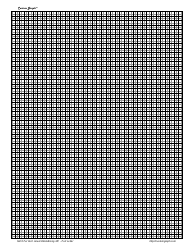
Graph Paper Template With X and Y Axis

A Graph Paper Template With X and Y Axis is used for plotting points in mathematics or physics, drawing diagrams, and graphing equations. It provides a grid system where the X axis (horizontal) and Y axis (vertical) intersect at a central point known as the origin. Each square on the graph represents a specific increment, allowing for precise measurements and calculations. This type of graph paper can be particularly useful in subjects like geometry, trigonometry, and calculus, as well as in certain fields of engineering and design.
A graph paper template with X and Y axis is typically filed by students, mathematicians, physicists, engineers, and other professionals who need to plot mathematical functions or diagrams. These templates can be used by anyone working in professions where graphing and diagramming are necessary. It's not specific to any country, so those in the USA, Canada, India, Australia, and all over the world use them. Generally, such templates are not officially 'filed' with any governmental entity, but rather used for individual or company purposes.
FAQ
Q: What is a graph paper template with X and Y axis?
A: A graph paper template with X and Y axis is a grid system where each square represents a specific measurement. The X-axis typically displays horizontal data, while the Y-axis shows vertical data. This type of template is often used in math, engineering, or other technical fields to effectively plot data or draw graphs.
Q: How to use a graph paper template with X and Y axis?
A: To use a graph paper template with an X and Y axis, first identify the scale of your graph. Each square in the grid will represent a specific value. Plot your data points by drawing a dot where the X and Y coordinates meet. Connect the dots to create a visual representation of your data if needed.
Q: Why is a graph paper template with X and Y axis useful?
A: A graph paper template with an X and Y axis is useful because it provides a scaled, visual aid to help plot data points with precision and accuracy. This is particularly helpful in fields like math and engineering where complex data sets need to be visualized and analyzed.
Q: Can I create a graph paper template with X and Y axis on Microsoft Excel?
A: Yes, you can create a graph paper template with X and Y axis on Microsoft Excel. You can do this by adjusting the column widths and row heights to make them square, and then using the 'draw border' function to create a grid. You can then label your X and Y axes as needed.